

March 23rd, 2026 sees the quarterly rebalancing of major S&P indices, affecting benchmarks from the Australian ASX 200 ($XJO) to the US S&P 500 ($SPX), MidCap 400 ($MID), and SmallCap 600 ($SML) indices.
When an index rebalances, it ensures that the benchmark accurately represents the current market landscape. However, as the latest data shows, representation does not always equate to stability.
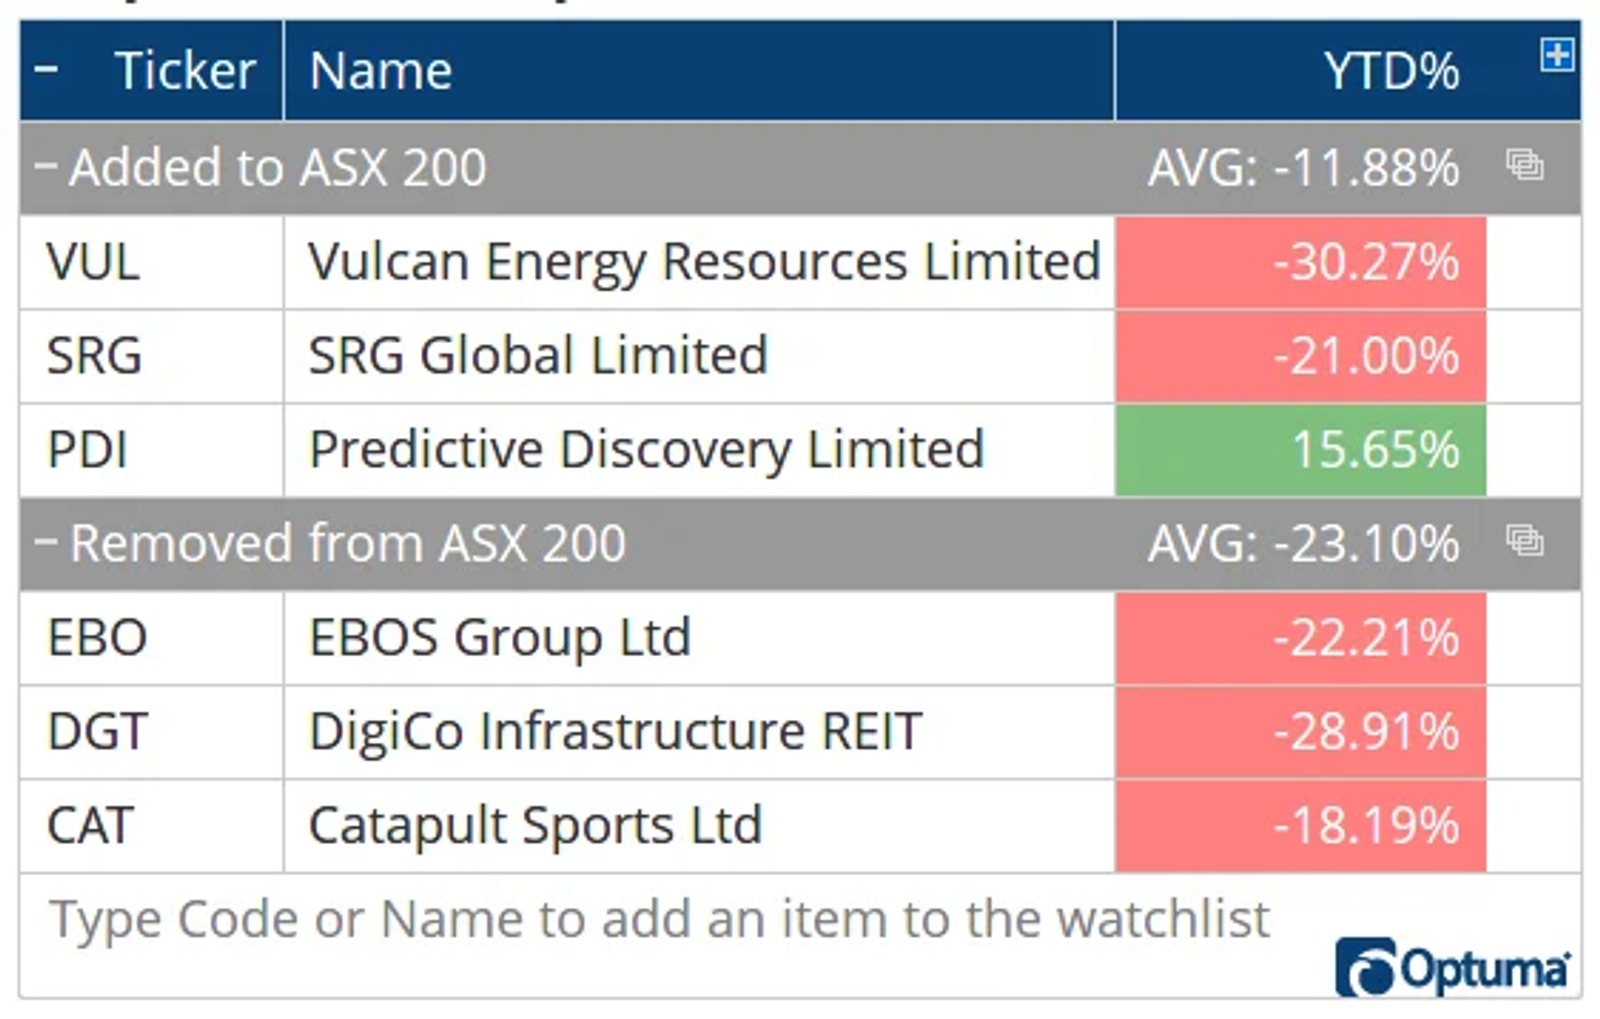
In Australia, three changes were made to the ASX 200. Notably, the companies being removed were only added last year. In fact, Catapult Sports ($CAT) has seen its market value halve since joining the index less than six months ago.
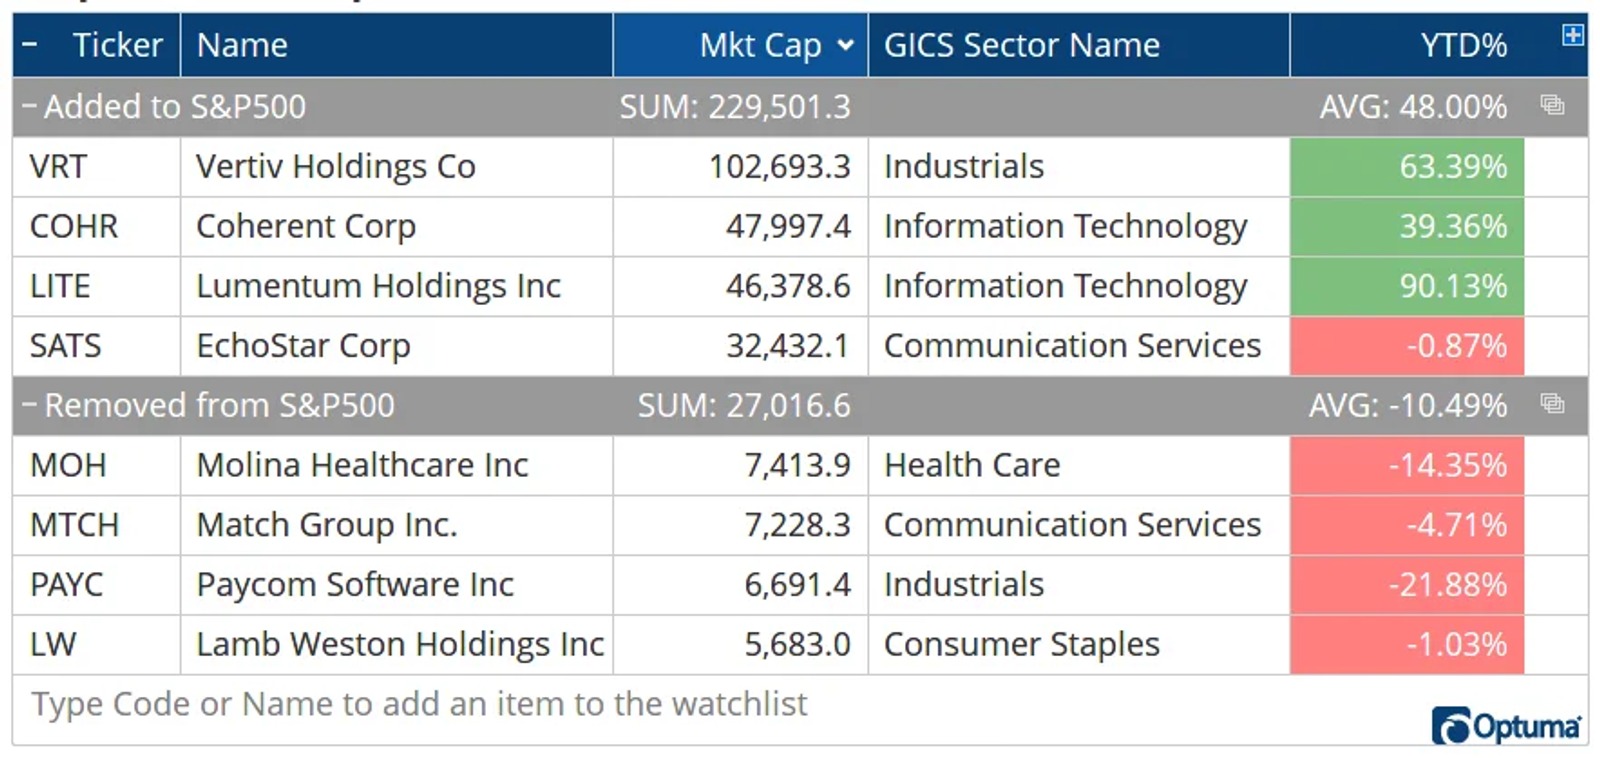
In the United States, the S&P 500 sees four major additions this quarter, with over $200 billion in market capitalization entering the index (50% of which is concentrated within the Technology sector).
The “Index Effect”: Performance vs. Expectation
A common hypothesis in finance is that inclusion in a major index leads to outperformance due to forced buying from passive ETFs and mutual funds. However, empirical data often paints a more nuanced picture.
By utilizing the IsMember() function within Optuma to track entry and exit dates, we can analyze the “post-addition” performance of last year’s S&P 500 newcomers.
- The Winners: Out of 18 companies added in 2025, only 7 have posted gains since the day they joined. Sandisk ($SNDK) leads the pack, surging 250% since late November.
- The Losers: Nine additions have seen double-digit declines. The Trade Desk ($TTD) sits at the bottom, experiencing a 71% loss since its inclusion.
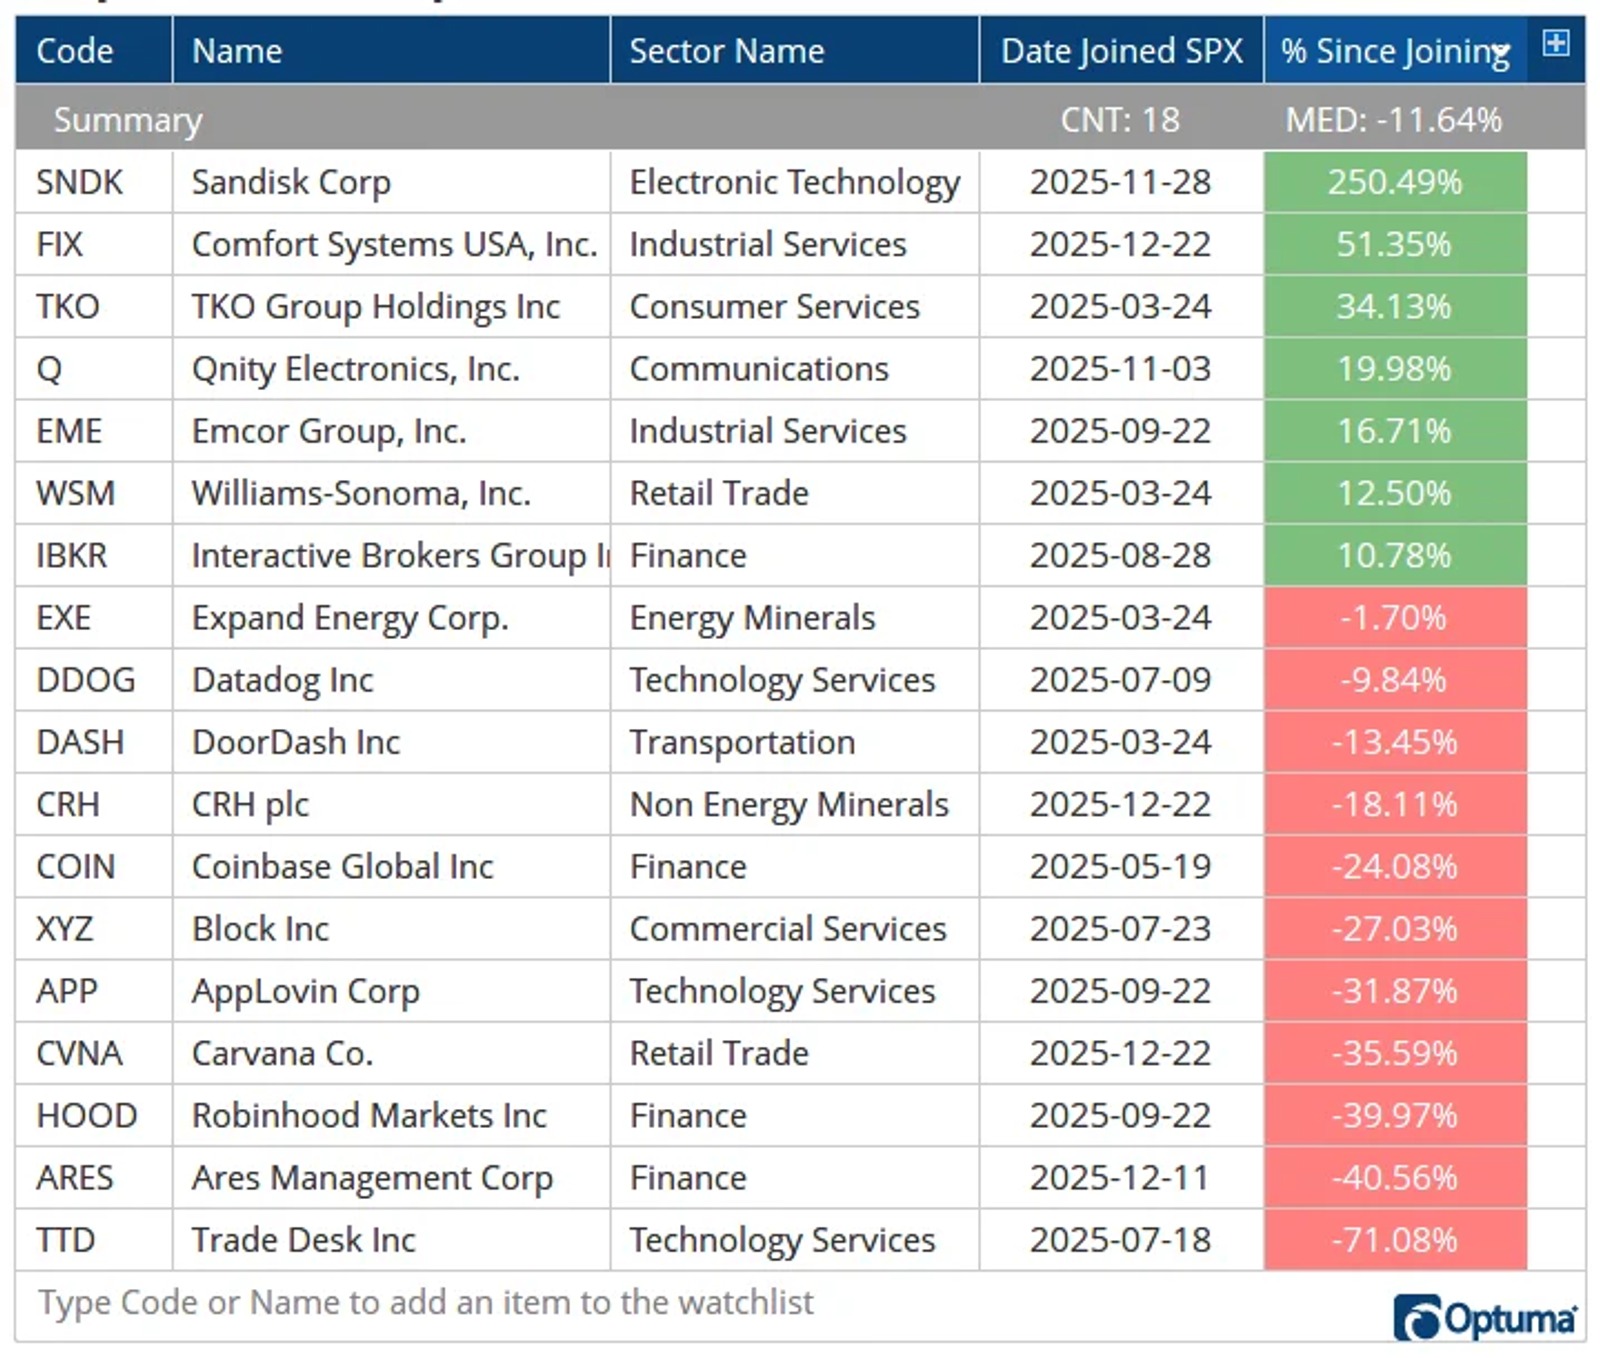
This data suggests that while index inclusion provides liquidity and prestige, it is not a guaranteed catalyst for price appreciation.
Quantitative Accuracy: Solving for Survivorship Bias
For researchers conducting backtests on index-linked strategies, historical accuracy is paramount. A common pitfall is failing to account for Survivorship Bias.
If you were to test a strategy on the current members of the S&P 500 over a ten-year period, your results would be artificially inflated. You would be testing companies that succeeded enough to stay in the index while ignoring those that went bankrupt or were delisted.
For instance, a valid historical test should ignore Tesla ($TSLA) signals prior to its December 2020 inclusion and instead account for the company it replaced, Apartment Investment & Management Co ($AIV). Managing these shifting memberships manually is a recipe for data errors but for those using Optuma Symbol Lists, these updates are seamless. Your linked scans, watchlists, and signal testers will automatically reflect membership changes, ensuring accuracy in your analysis. For a deeper dive on survivorship bias, see Mathew Verdouw’s article here.

Senior Software Specialist at Optuma
Darren is the senior Software Specialist at Optuma based in Brisbane, Australia. Darren grew up in the UK and attended college in the USA where he earned a BA in Economics from St Mary's College of Maryland. He went on to spend a few years working at the Nasdaq Stock Market in Washington DC. Darren joined Optuma in 2009 after attending an introductory technical analysis course that used the software.


