

Price return and total return are two different ways to measure the performance of stocks, bonds, and ETFs. Here are the key differences:
Price Return
- Price return, also known as capital return, only considers the change in the asset's price or market value over a specific period.
- It does not take into account income generated from the asset, such as dividends for stocks or coupon payments for bonds.
- Price return is a simple measure of how the market value of the asset has changed, excluding any income received.
Total Return
- Total return includes not only the price appreciation of the asset but also any income generated from it, such as dividends, interest, or distributions.
- It provides a more comprehensive view of an investment's performance as it accounts for all sources of return.
- Total return is often considered a more accurate measure of an investment's true profitability.
What data should I be using?
Generally, technical analysts use Price Return data because those are the prices at which the stocks actually traded (ignoring stock splits!). Total Return data changes the historical prices to take into account the extra income from the dividend or interest payments. By default, the charts in Optuma are Price Returns, but - if using our end-of-day data - it's possible to display the Total Return data by clicking on the chart header:

Here's an example showing the difference with IBM. The Price Return in black has been overlaid with the Total Return chart (green):
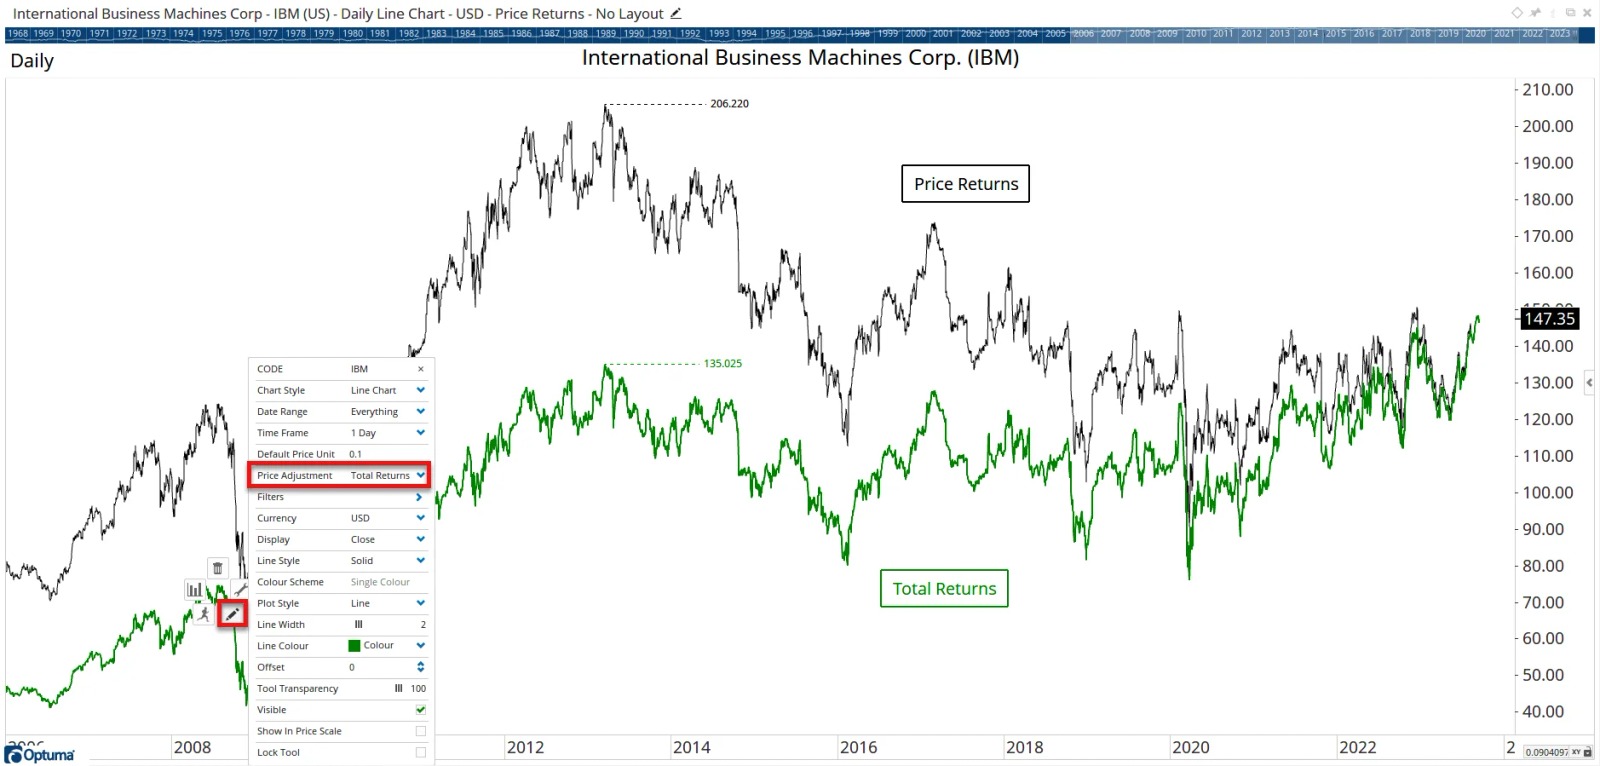
As you can see, the further back you go the bigger the disparity between the lines because more dividends have been paid so the more the historical prices drop. Recent prices will converge, and will be the same since the last payout.
On a price return basis IBM is currently at $147, way below its 2013 all-time high of $205, but when the dividend payouts are included the equivalent price at that time was $130. This means that if you bought (and held!) IBM back then and received all the dividends you would be up about $17 per share - although I'm not sure how many of you would have held on until the 2016 low!
Note
In the new testers currently in development, we will be calculating performance using total returns (when the data is available). This way the testers factor in dividends into the strategy results.
Comparing historical returns
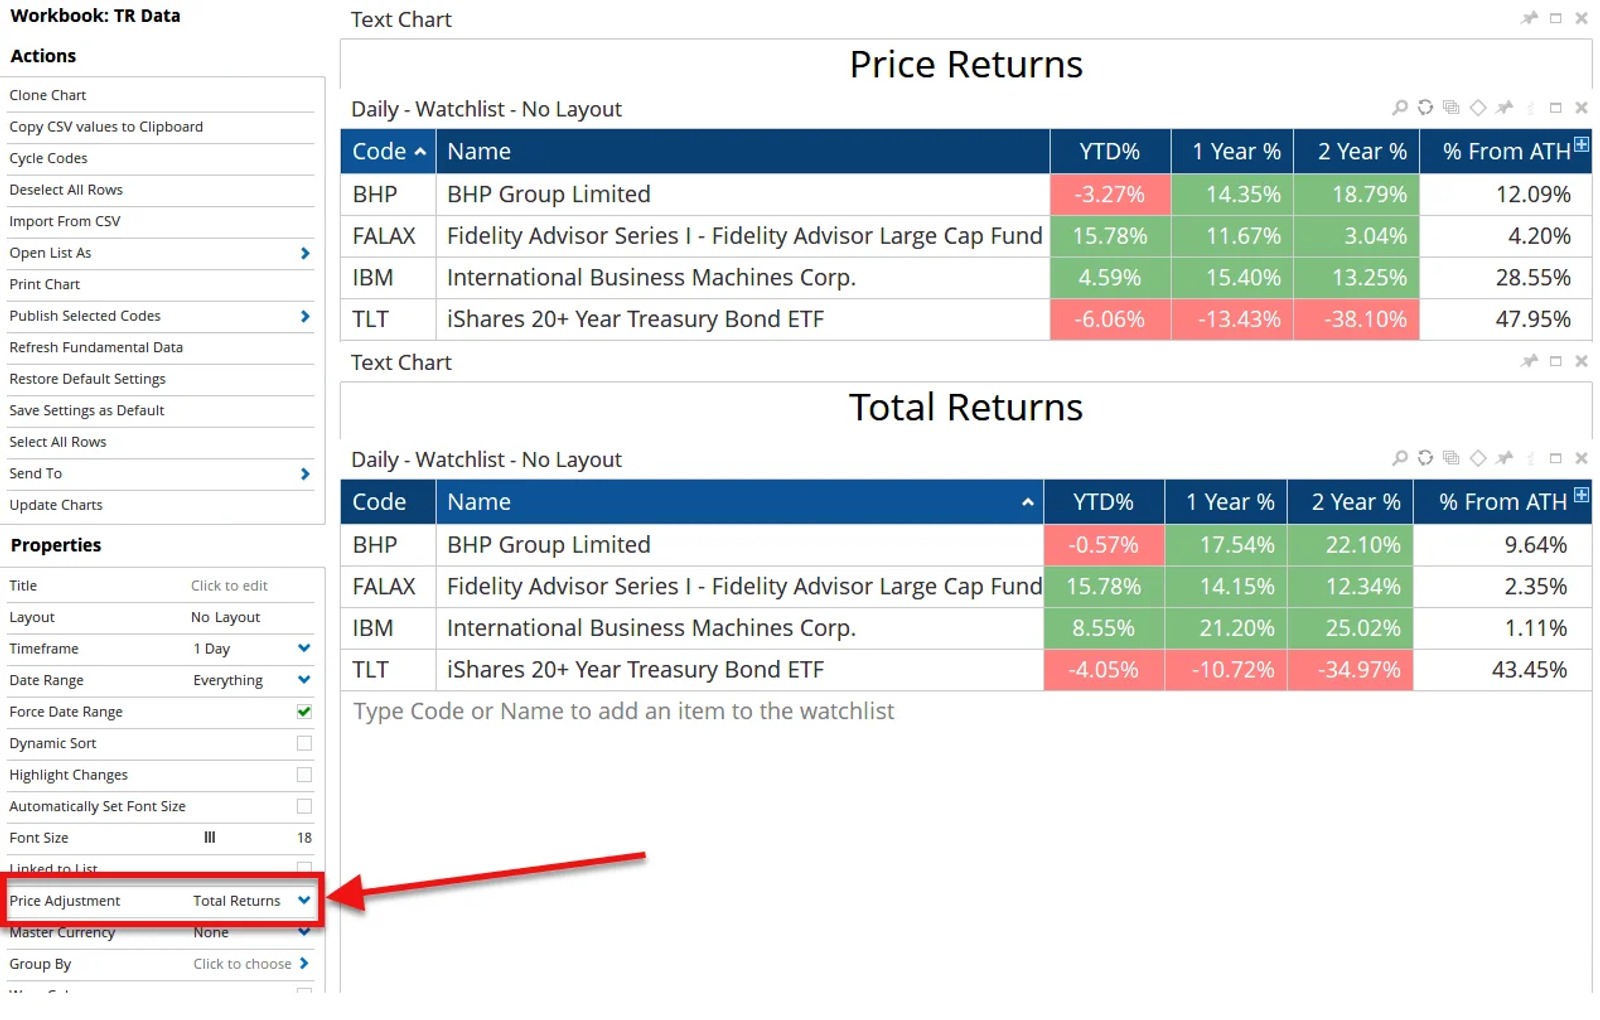
It's possible to compare the total returns in Optuma's watchlists. Below are two identical lists with the same column formulas. By changing the Price Adjustment property in the bottom watchlist to Total Returns, all the column calculations will use the historically adjusted data. So BHP on the ASX has gained 22% over the last two years when taking into account dividends, versus only 18.8% on a price return basis. The other examples are for a Fidelity US Mutual fund, a stock, and a bond ETF:
Note
If you are unable to see any difference between price and return charts the most efficient way to ensure that the historical adjustment factors have been downloaded would be to download the full exchange history again under ( Data > Exchange ) menu.
In summary, price return focuses solely on changes in the market price of an asset, while total return provides a measure of the returns you would have achieved from holding the security by considering both price changes and income generated by the asset, giving a more accurate representation of an investor's actual gains or losses.

Senior Software Specialist at Optuma
Darren is the senior Software Specialist at Optuma based in Brisbane, Australia. Darren grew up in the UK and attended college in the USA where he earned a BA in Economics from St Mary's College of Maryland. He went on to spend a few years working at the Nasdaq Stock Market in Washington DC. Darren joined Optuma in 2009 after attending an introductory technical analysis course that used the software.


