

As you may know, Optuma watchlists allow you to add custom columns containing any tool or indicator values (eg daily/weekly RSI, percent from a moving average or 52 week high) or true/false results based on any condition (is the close above the 34 exponential moving average, or is the Gann Swing trending up?). It's also possible to create performance statistics based on time frames (eg over the last month, year-to-date, or from a specific date), but you can also create quarterly (or monthly) returns. The following article will show you how to add these types of calculations to a watchlist - or you can skip to the bottom to download a workbook!
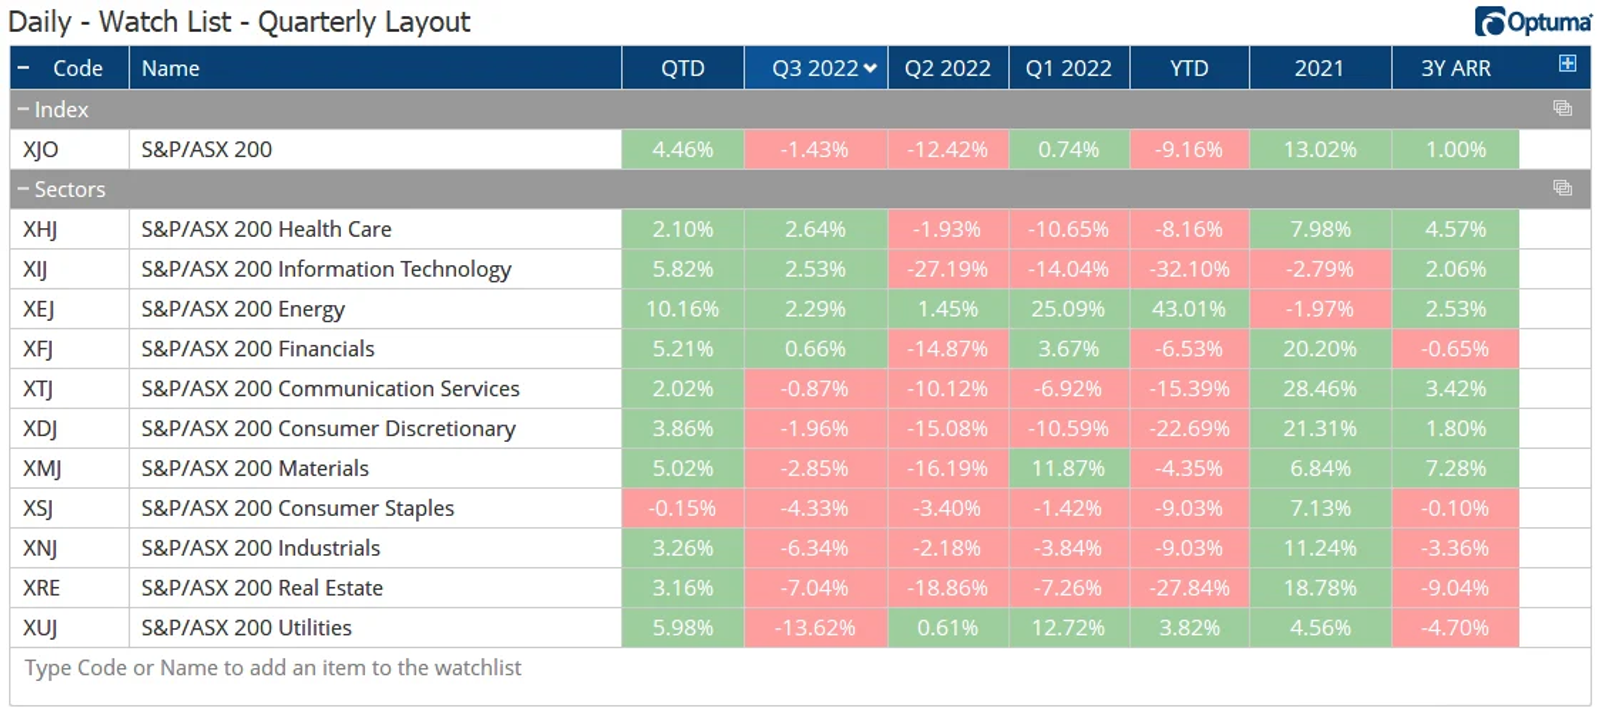
The example below shows the quarterly performance of the Australian ASX 200 index and sectors for 2022, along with year-to-date and the 3 year annual rate of return. Sorted by Q3 performance, it shows Health Care $XHJ gaining 2.64%, following Q2's -2% and Q1's -10.65%. On a year-to-date basis, the clear winner is Energy $XEJ at +43% to Friday's close (click images to enlarge).
Here's how to calculate these values in any watchlist by combining the following functions to specify the periods:
MONTHNUM() - assigns a number for each month: 1 = January, 2 = February, etc
YEARNUM() - eg 2022
VALUEWHEN() - returns the required value (the close by default) when a certain condition has been met.
So to get the closing value at the end of the third quarter in 2022 we need to create a variable (M1) for the end of September 2022:
M1 = MONTHNUM() == 9 and YEARNUM() == 2022;Note: in scripting a single ‘=’ sign is used to assign a variable so when looking for equality in a formula we need to use the double ‘==’ sign.
Next we use VALUEWHEN to get the closing value of M1 by placing it in the parentheses:
V1 = VALUEWHEN(M1);So now we have June’s closing values (V1) we need to compare it to the end of June 2022 by creating two more variables:
M2 = MONTHNUM() == 6 and YEARNUM() == 2022;V2 = VALUEWHEN(M2);With these two closing values (V1 and V2) we can now calculate the percentage change between them using the DIFFPCT() function:
DIFFPCT(V1,V2)/100NOTE: the last lines have been divided by 100 to display the watchlist columns in percentage format (as per the image and workbook examples below). In the watchlist, right-click on the column header and change the Column Type to Percentage.
Putting it all together for the Q3 2022 column:
M1 = MONTHNUM() == 9 and YEARNUM() == 2022;
M2 = MONTHNUM() == 6 and YEARNUM() == 2022;
V1 = VALUEWHEN(M1);
V2 = VALUEWHEN(M2);
DIFFPCT(V1,V2)/100
Current Quarter-to-Date (QTD)
To calculate the performance for the current quarter we can change the M1 variable to CLOSE() so it will use the latest closing price in the calculation, and will therefore update every day.
M1 = CLOSE();YTD
The year-to-date column is quite straight forward, using the Rate of Change function set to use yearly data, so a 1 bar change from the end of the previous year. NOTE: This will calculate the performance to the latest date downloaded, not the end of the quarter and will update every day.
ROC(Year(PERIODAMOUNT=1), BARS=1)/1002021 Performance
To calculate the column for 2021's performance we just use the same formula as the YTD column above but offset it by 1 - the number in the square brackets. Increase the offset value for earlier years, ie [2] for 2020.
Y1=ROC(Year(PERIODAMOUNT=1), BARS=1);
Y1[1]/100
{% endhighlight js %}

## Annual Rate of Return

This is calculated using the [ARR()](https://help.optuma.com/kb/faq.php?id=1112) function, set to 3 years in this example:

{% highlight js %}
ARR(PERIODAMT=3)/100
So the best performing sector over the last 3 years to date (ie from October 2019 to October 2022) has been Materials $XMJ, gaining 7.28% per year for the last 3 years. Real Estate $XRE has lost 9% per year.
Custom Column Colours
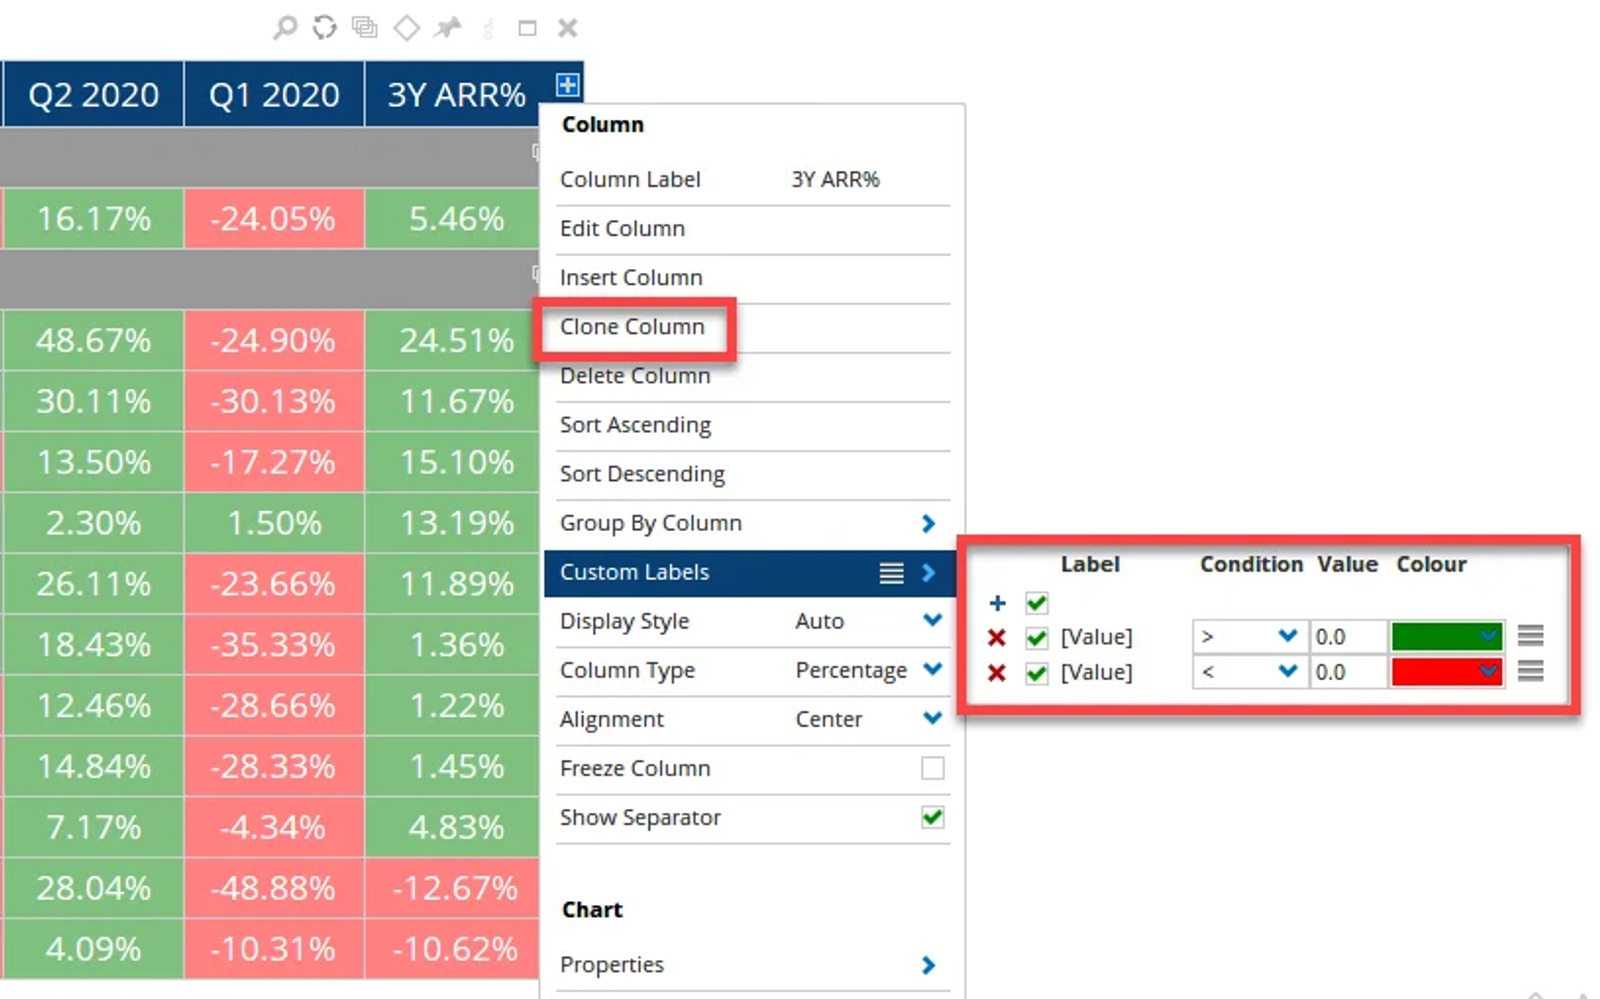
To change the watchlist colours to green for positive and red for negative right-click on the column heading and select Custom Labels, and select green > 0 and red > 0 (delete the Label text as it's not required in this example). Once changed, click on Clone Column to duplicate the column and then Edit Column to open the Script Editor window and change the formula for subsequent columns as required.
Workbooks
Optuma clients can click the buttons below to save a workbook with examples for Australian and US sectors, but if you would like to apply these columns to other watchlists click the No Layout label in the header and give it a name and then apply the Watchlist Layout to another list.
Of course, columns can be added, removed, or dragged to a new position to your watchlists as required. If you have any questions or comments please let us know, or visit our Scripting Forum for help and more watchlist ideas.

Senior Software Specialist at Optuma
Darren is the senior Software Specialist at Optuma based in Brisbane, Australia. Darren grew up in the UK and attended college in the USA where he earned a BA in Economics from St Mary's College of Maryland. He went on to spend a few years working at the Nasdaq Stock Market in Washington DC. Darren joined Optuma in 2009 after attending an introductory technical analysis course that used the software.


