
Read Part 2 | Andrews’ Pitchfork: Application and Analytical Methods Using Median Line Analysis
Read Part 3 | Andrews’ Pitchfork: Advanced Analytical Methods Using Median Line Analysis
Although the technical methodology known as Median Line Analysis as we know it today is rightly attributed to Dr. Alan Andrews, it should be known that it found its genesis hundreds of years before his time. That said, it was Andrews who brought it forward to the study of stocks, bonds, currencies, and commodities. Andrews’ extensive analysis and studies are the basis of what is now referred to as Andrews’ Pitchfork. It has been elaborated on since his passing by several of his students who studied directly with him, and by a number of learned and talented technicians who have refined and studied it in concert with other indicators. It’s been said his disciples, who were grain traders, were responsible for attaching the moniker Andrews’ Pitchfork to the technique—what we believe is an underutilized technical tool that belongs in every analyst’s toolbox.
In this first article of a series of three, we’ll look at the history and development of the pitchfork, but it may be useful to start with an overview of the tool and see how it is constructed.
What is Andrews’ Pitchfork?
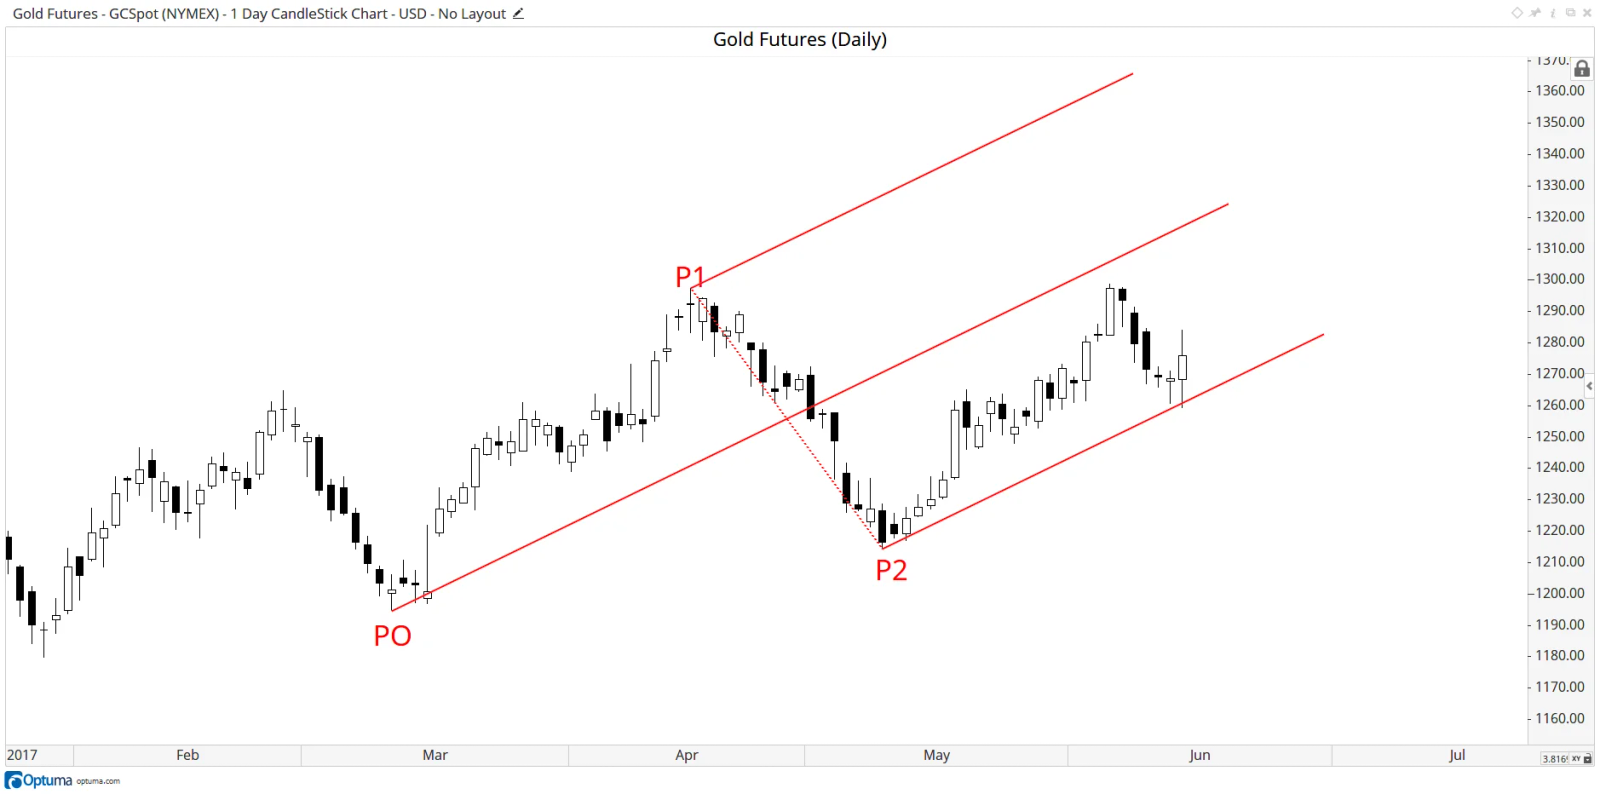
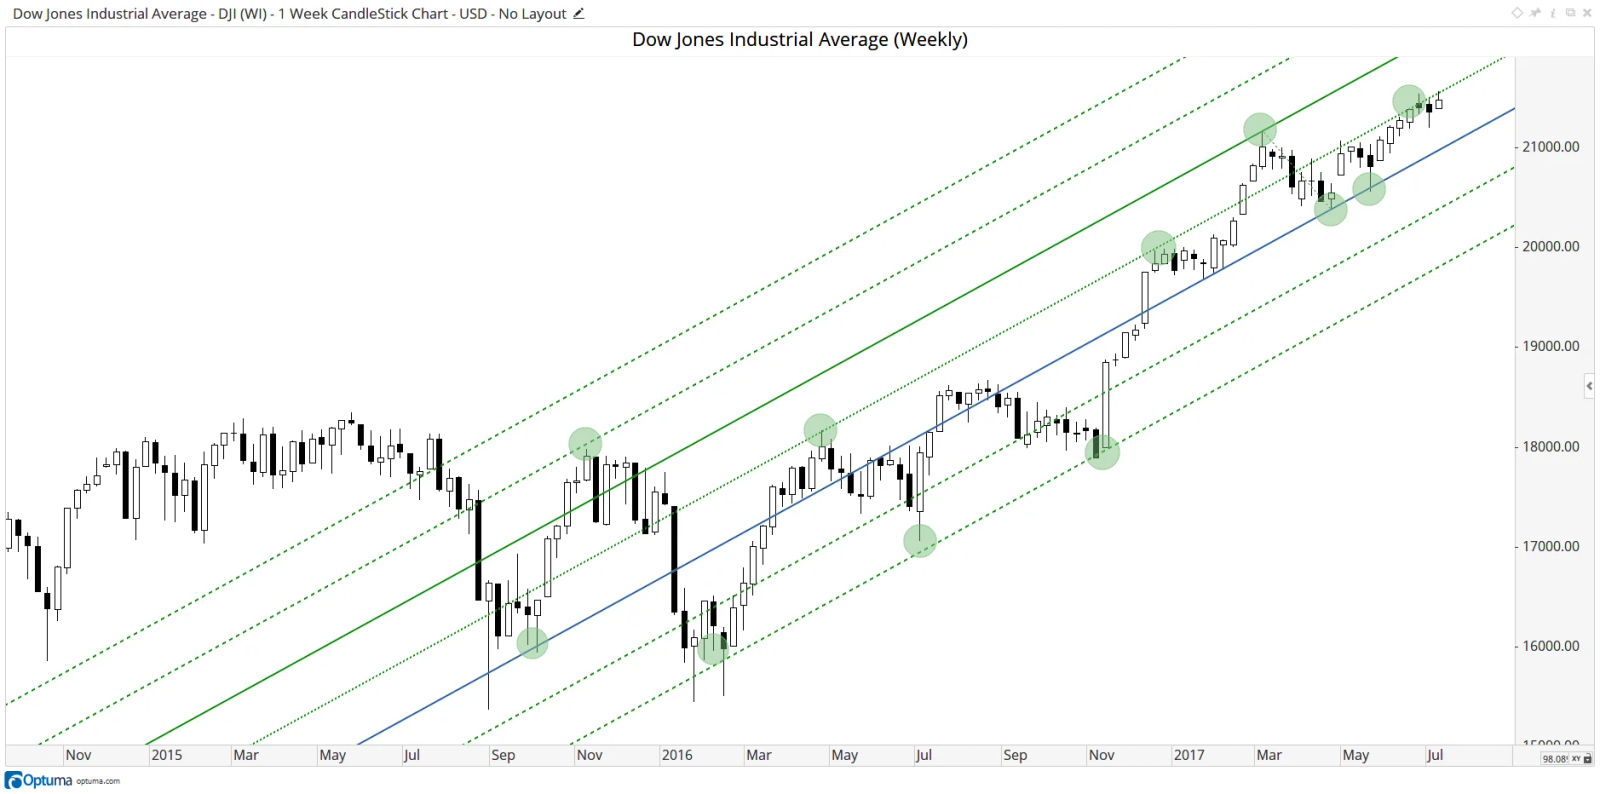
Andrews’ Pitchfork is a trend channel tool consisting of three lines, determined by picking three points on the price chart that mark reaction highs or reaction lows, and is available as a standard tool in Optuma.
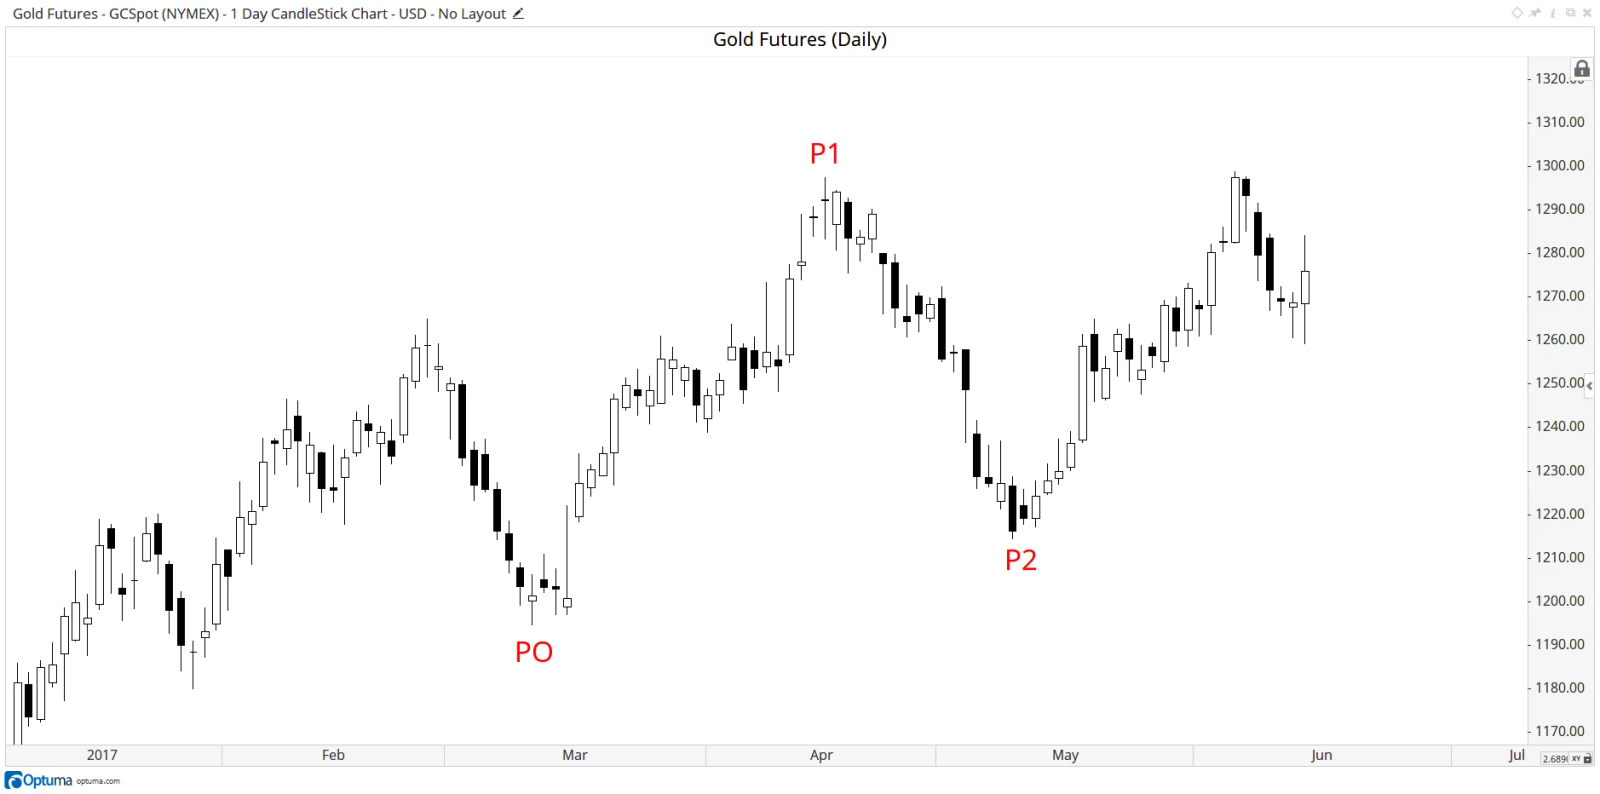
In the Gold chart below, we’ve marked the start of the median line at a reaction or swing low at <font color='red'>P0</font> (point of origin). We then mark the next pivot at the high <font color='red'>P1</font>, and the next pivot at the higher low at <font color='red'>P2</font>, and identify the midpoint of <font color='red'>P1</font> and <font color='red'>P2</font> (click images to enlarge).
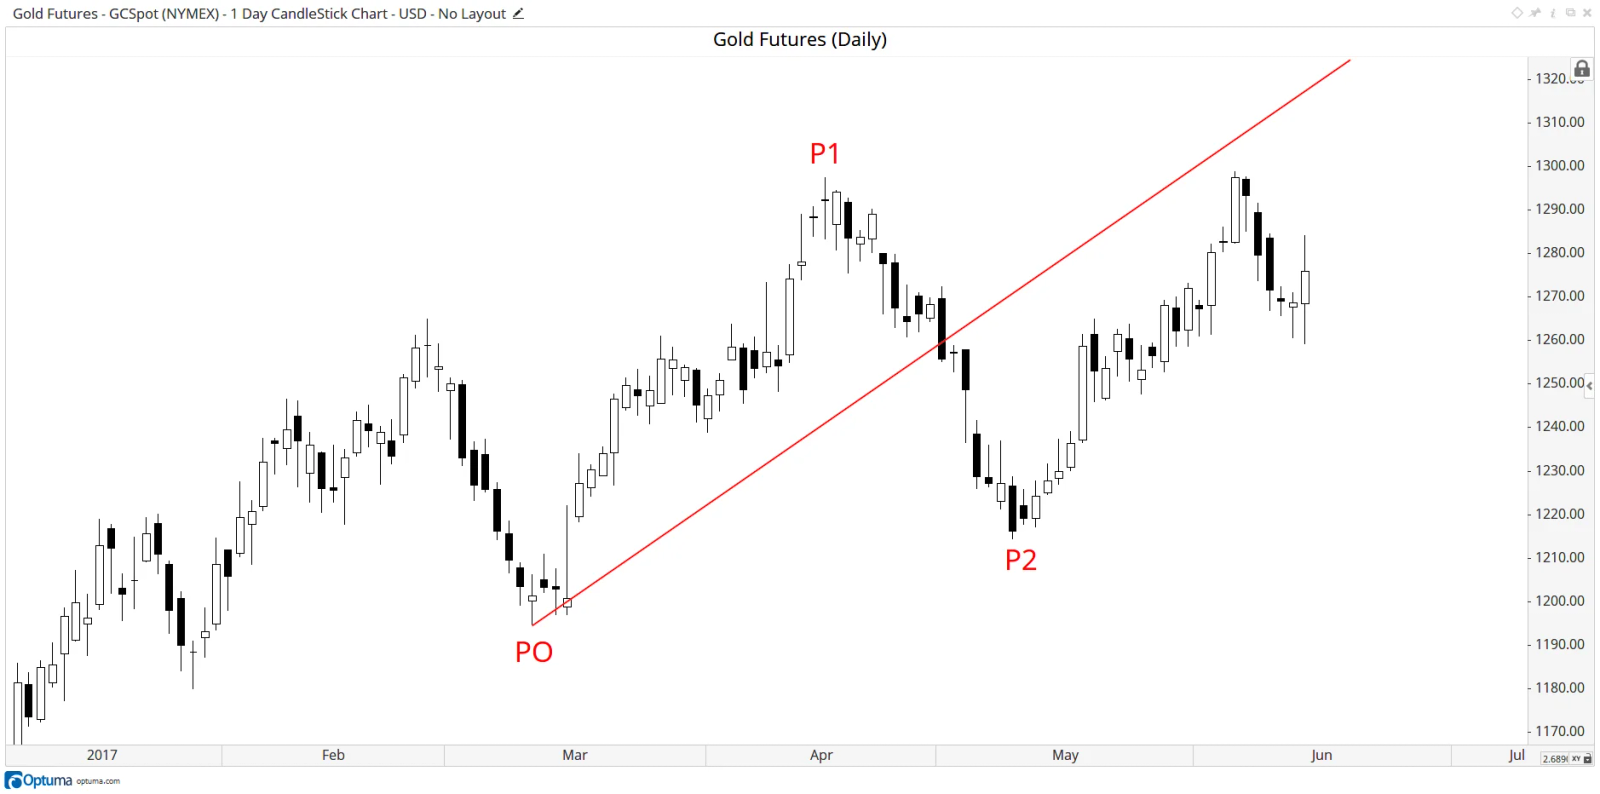
The median line is drawn from the first pivot at <font color='red'>P0</font>, through the midpoint of <font color='red'>P1</font> and <font color='red'>P2</font>, as shown in the chart below:
A “swing line” is added between the <font color='red'>P1</font> and <font color='red'>P2</font> pivots, and parallel lines are projected from <font color='red'>P1</font> and <font color='red'>P2</font>. This creates the pitchfork which represents a price channel:
Now we understand how the tool is constructed, let’s take a look at its history and development.
Roger Ward Babson
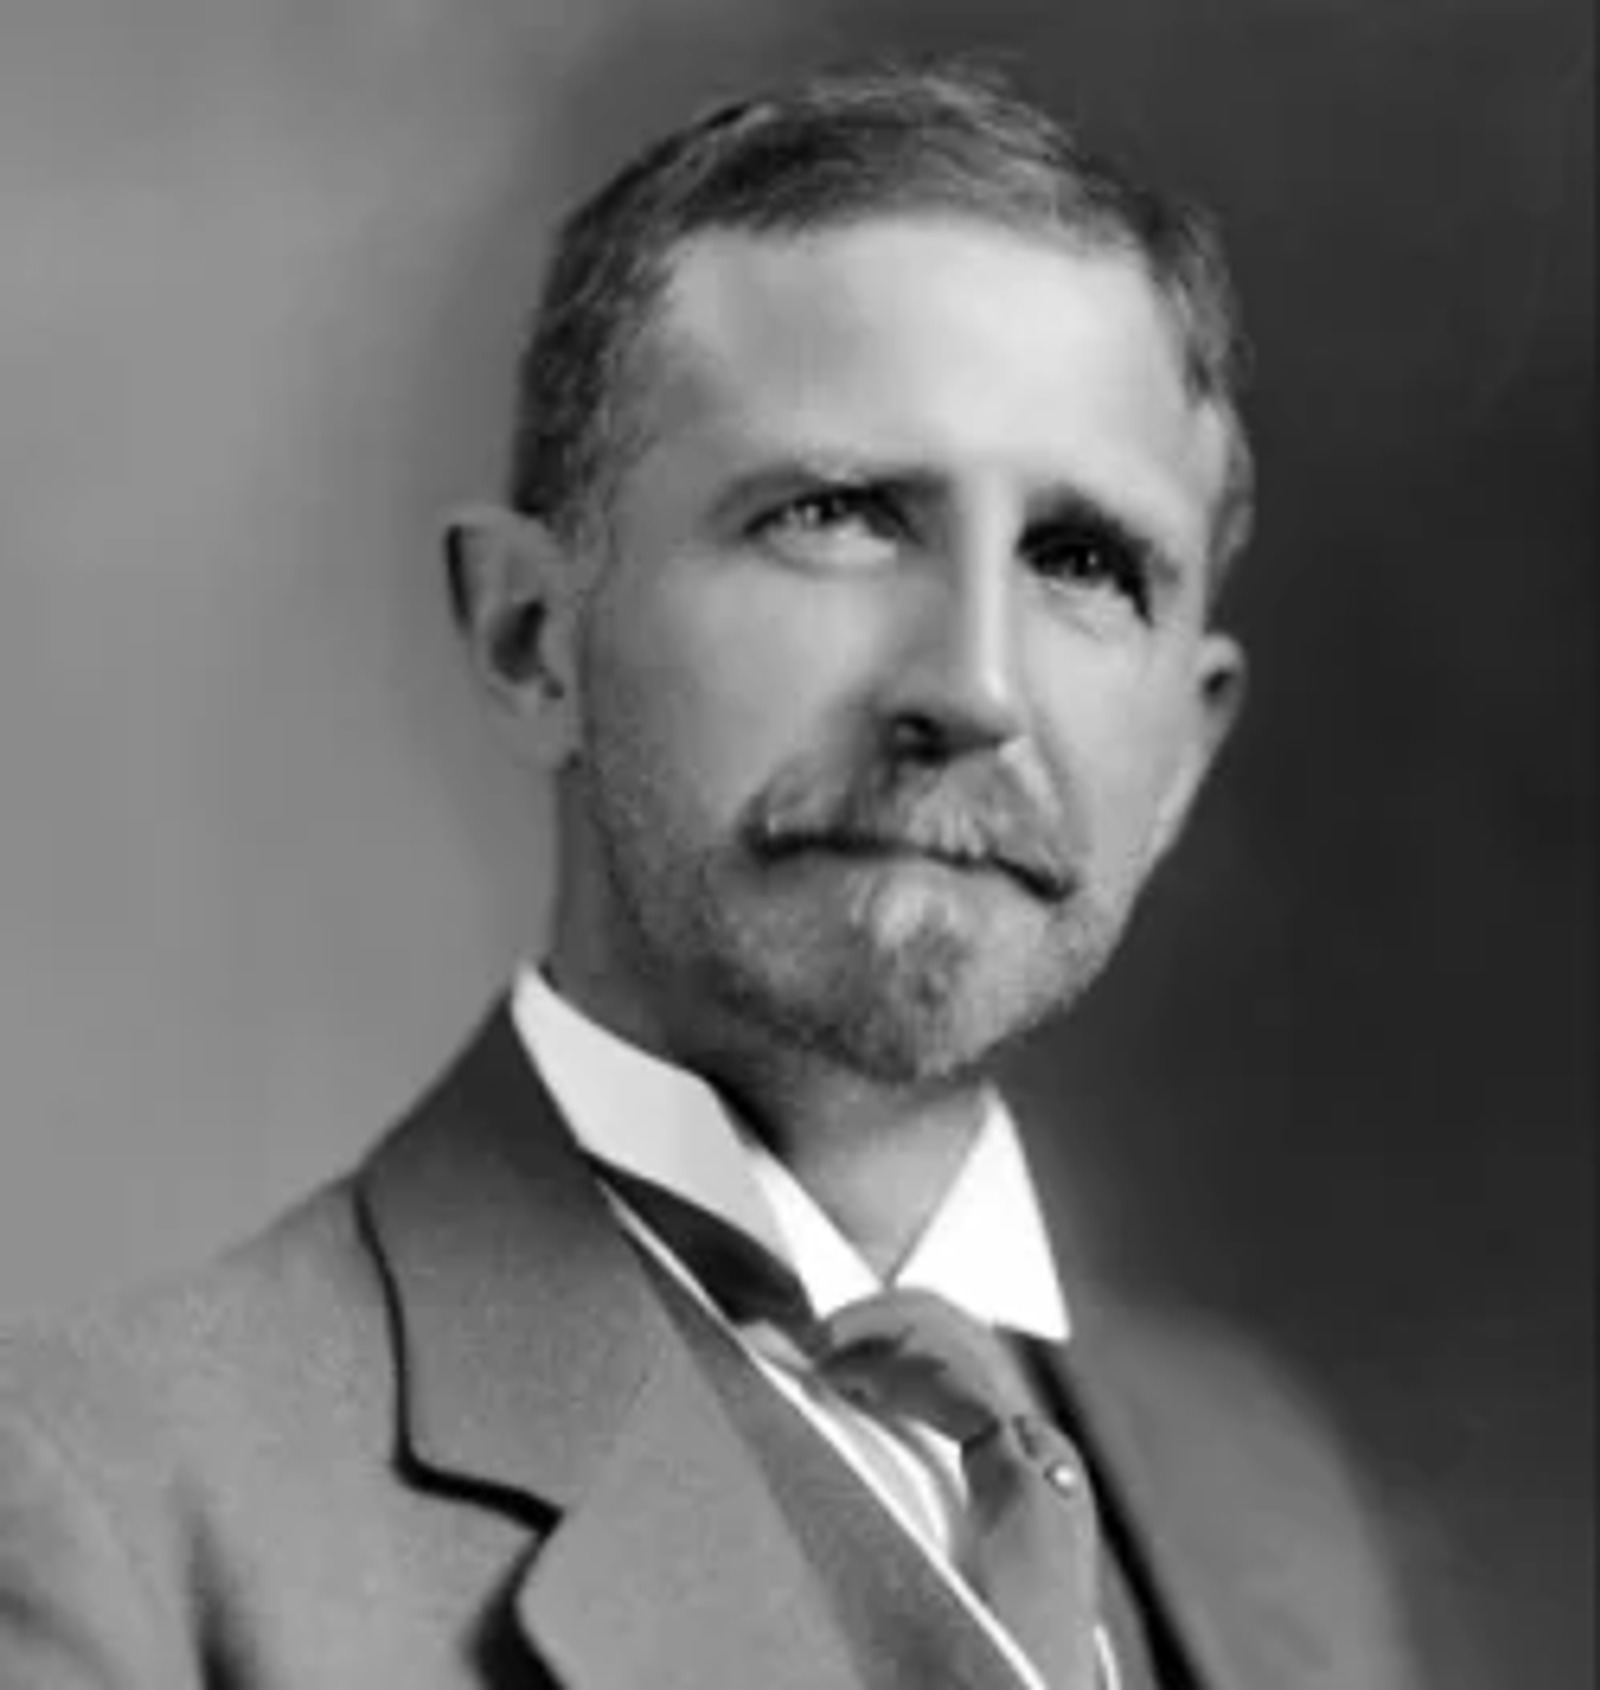
Roger Babson was born in Gloucester, Massachusetts on July 6, 1875. His father, Nathaniel was a dry-goods merchant in the city, and his mother Nellie owned a millinery store. His was a typical childhood of that period, although he relates he was an unruly child who suffered whippings by the hand of his teacher, as did most children who “acted up” during school. The first statistics that Babson compiled even at that early age, were the record of thrashings that various boys and girls received during the school year. His score was forty-seven. This was a dubious start, but a start nonetheless to a renowned career as a statistician, bond trader, businessman, economist, and writer that spanned decades and left a legacy and place of notoriety in the history of financial markets. It was his founding of Babson’s Statistical Organization, and his long-standing relationship with a professor of engineering, George F. Swain, whom he studied under at the Massachusetts Institute of Technology, where Babson received his training as an engineer from 1895-1898. From here the two men’s friendship was forged. It is their philosophical connection that interests us, and their development of the Median Line Analysis.
George Fillmore Swain
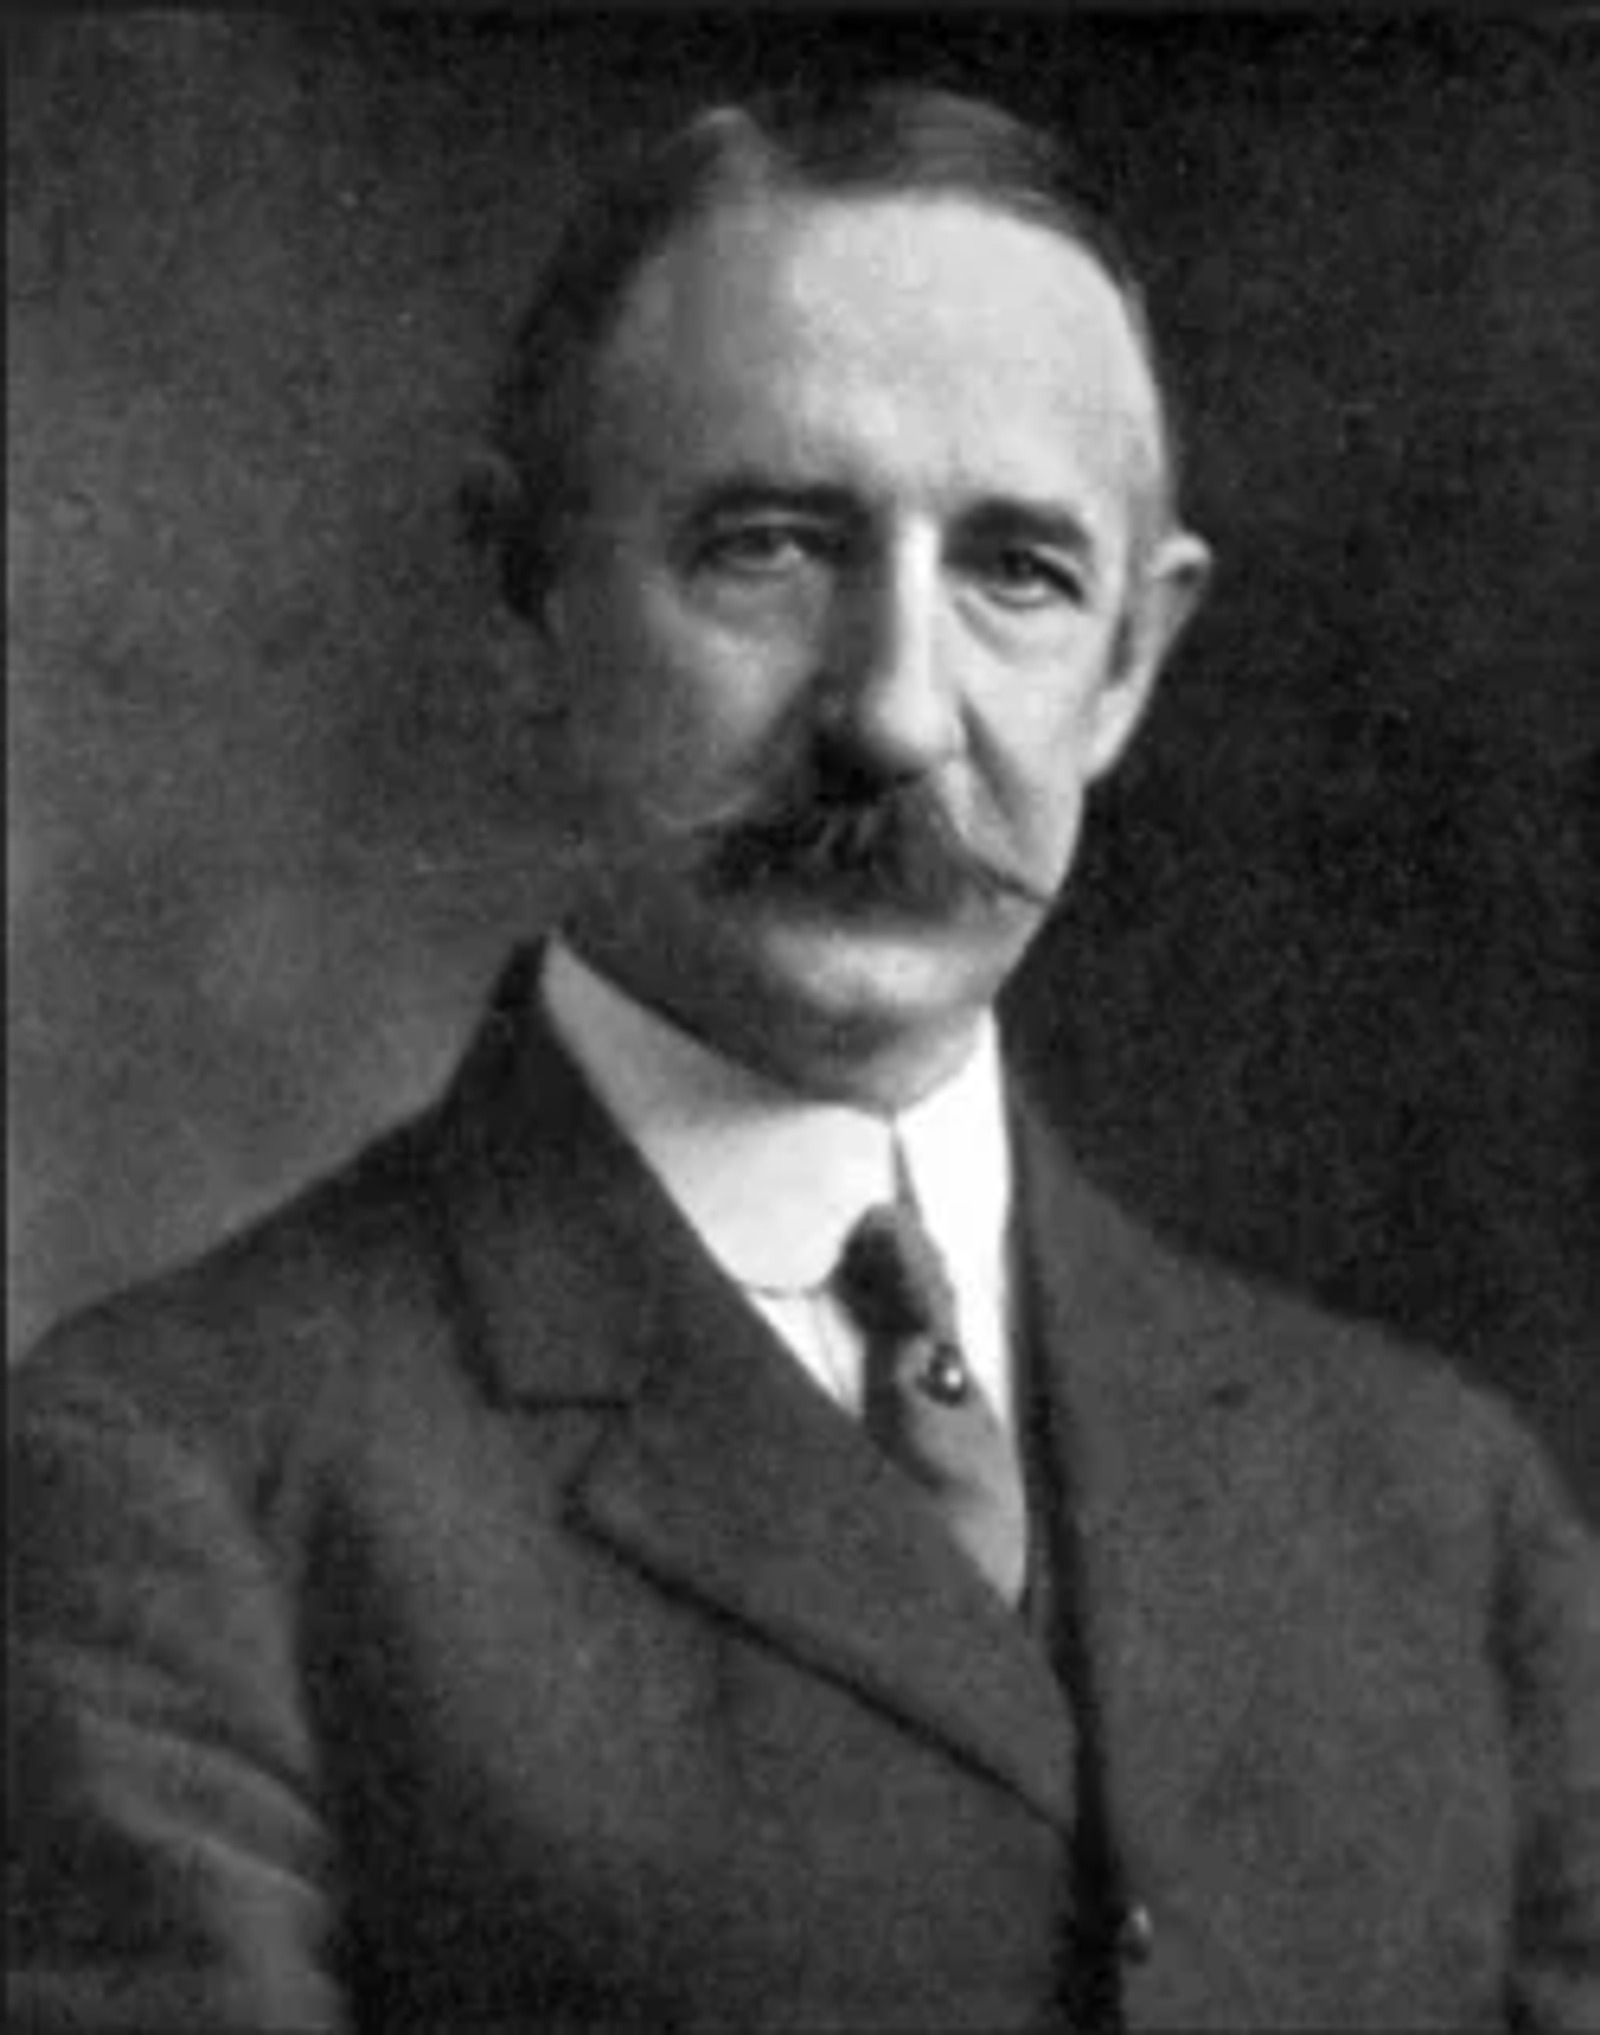
Babson was in New York selling his bond statistical analytical research on the day of the 1907 stock market crash, and was taken aback by the large losses accumulated by supposed learned and experienced market professionals. At the time, he had been studying Benner’s Prophecies of Future Ups and Downs in Prices [1] and How Money is Made In Security Investments [2], believing that there must be have been a way to forecast economic and market changes in a more proactive and less reactive manner. With these two books and his own amassed statistical data in hand, he sought out his former professor and friend George Swain. Both concluded that there was the basis in these two books and Babson’s collected data that, when applied properly, could forge a new method of forecasting. It was Professor Swain who introduced and drew a “normal line” through the historical data in the Babson’s Composite Chart of pig iron, corn, and hogs that would normalize the volatile “zig-zagging” index Babson had been developing. He also suggested that Newton’s Law of Action and Reaction may apply to this and other economic indicators, as it does to physics, chemistry, and astronomy. Thus was the origin of the famous Babsoncharts that were integrated into Babson’s Statistical Organization’s publications, and later analytically led to his famous timely prediction of the 1929 crash that was published in New York Magazine.
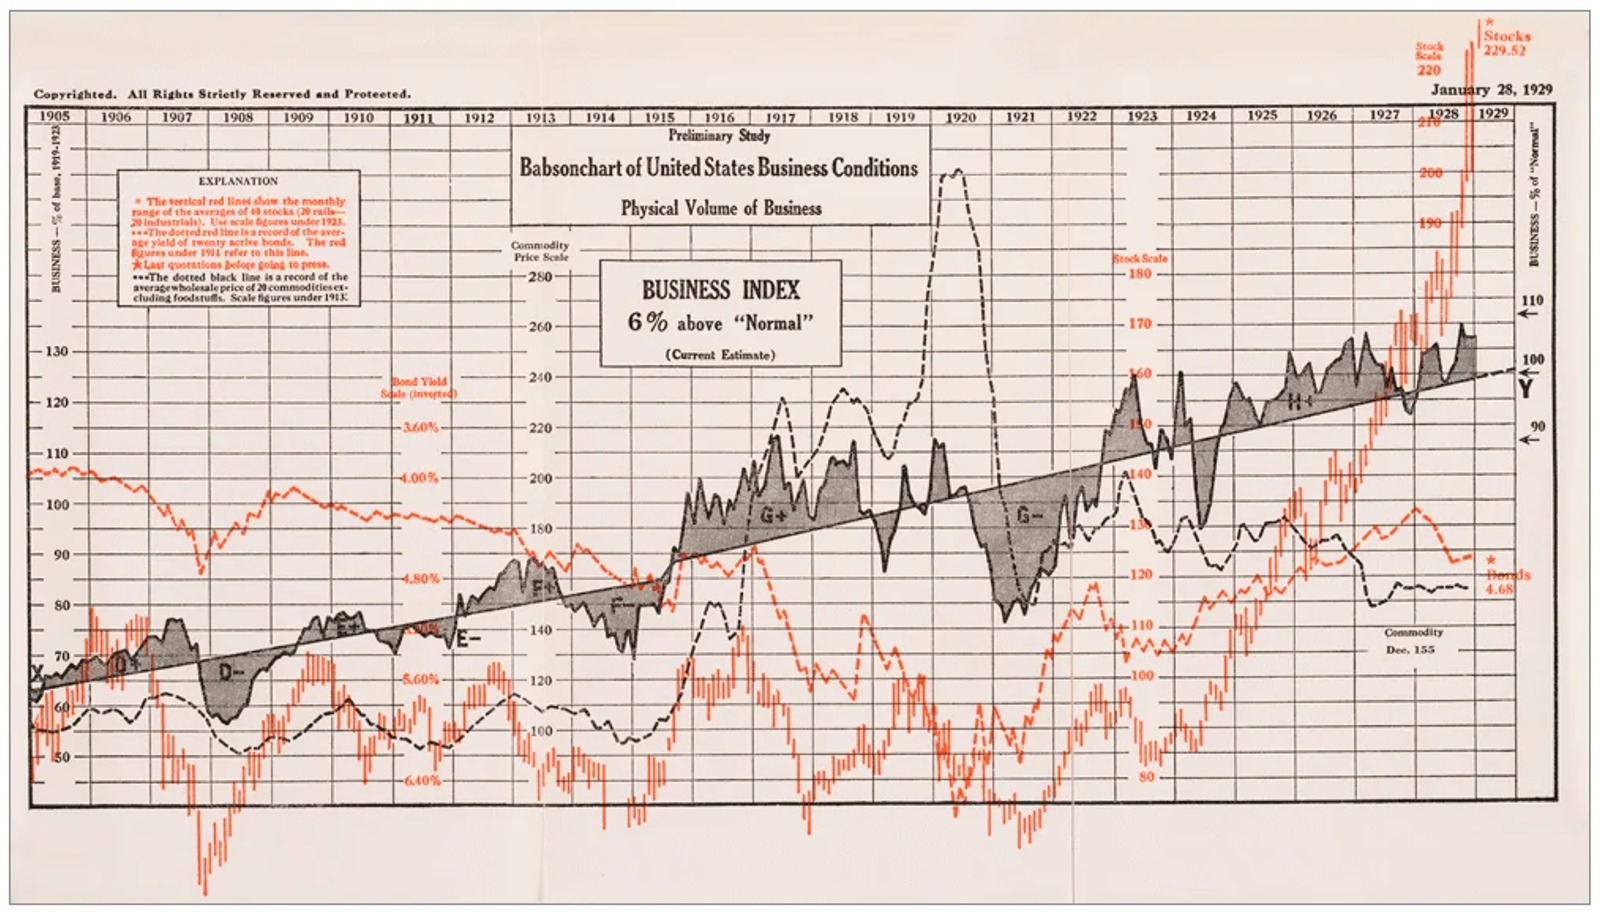
It was Babson’s further devotion to the work of Sir Issac Newton that later induced him to create the Gravity Research Foundation at the suggestion of Thomas Edison. It was at one of Babson’s seminars years later where he illustrated how Newton’s Third Law could be applied to the stock market, when he met Alan Andrews. They became hardened friends, and Babson taught Andrews his action and reaction techniques. Out of respect of Babson’s studies that he shared with Andrews, he later named his median line course the Action-Reaction Course, in acknowledgement of his mentor’s teachings.
Dr Alan Hall Andrews
Although Alan Andrews’ date of birth remains unknown, we do know he passed on in 1985. Little is known of his personal life, wife or children. His father owned a broker/dealer where he traded for clients and his own account, and is said to have made a large amount of money in the Great Depression. Alan’s father sent him to engineering school at Massachusetts Institute of Technology, and then on to Harvard. The story goes that after he graduated, his father challenged him to make one million dollars in one year while working at his father’s brokerage firm. He did not accomplish his father’s task in one year, but in two years had made one million dollars trading commodities. Andrews later became a lecturer in civil engineering at the University of Miami in Florida. After he retired, he returned to his roots and decided to not only manage his own investments, but to teach others. He began publishing a weekly advisory newsletter that he sold by subscription. The newsletter focused on his trading methods, and included recommendations for the coming week. He also created the FFES (Foundation for Economic Stabilization) Case Study Course, applying principles of mathematical probability to the production of profits from prognostication. It detailed various median line methods and other techniques that, including fan lines, he referred to as Horn of Plenty. He sold the course for the tidy sum of $1,500 during the 1960’s and 1970’s, and held seminars and one-on-ones that were attended by New York and Chicago pit traders. Andrews often incorporated his student’s observations and studies into his work, careful to name methods such at Schiff Adjusted Median Line (named after Jerome Schiff, a New York trader who brought it to his attention), and Hagopian Lines named after another one of his students.
In the next article we will see the ease at which Andrews’ Pitchfork (and the Schiff and Hagopian modifications) can be applied in Optuma, along with a few examples showing how it can be used to identify potential turning points.
[1] George Benner, Benner’s Prophecies of Future Ups and Downs in Prices (Cincinnati: Robert Clarke & Co., 1879). [2] Henry Hall, How Money is Made in Security Investments (New York: The De Vinne Press, 1907).
Managing Director of Technical Research and Founder and Principal of The Market’s Compass LLC
Timothy Brackett is a technical analyst with 30+ years’ financial markets experience both on the sell and buy side. He continues to monitor portfolio positions and searches for investment ideas utilizing technical analysis at Marketfield Asset Management LLC.


