

We're always working on new ideas at Optuma. Most of the ideas are great, and sometimes..... well let's just forget about the chart navigation joystick of Market Analyst 5!
A new chart that we have been working on for the next major release of Optuma (expected Q2) is an Historical Comparison Chart. This one lets us put in multiple securities, or the same security multiple times, and set different start dates for each. We can then compare each of their respective growths from their start date. This is to solve many requests we get for looking at overlays of charts and being able to shift their start dates.
As I was completing a preliminary test of the work (it's still unfinished), I noticed this chart and just had to share it.
Here I put the Dow in two times with start dates on October 20, 1987 and March 9, 2009 (well actually three, but I'm hiding 1932), as they were the lowest point in the market. My intention was to see how the recoveries compared from the two biggest recent crashes. I was astounded to see how closely they are tracking! Even the biggest corrections seem to be happening around the same time.
This surprised me because 1987 was a short sharp brutal correction and 2009 was the end of an 18 month global financial crisis. Yet there are so many similarities in how the markets have rebounded from each low. The take-away is obvious, if they continue to match, then the Dow is only just over half-way through the bull run!
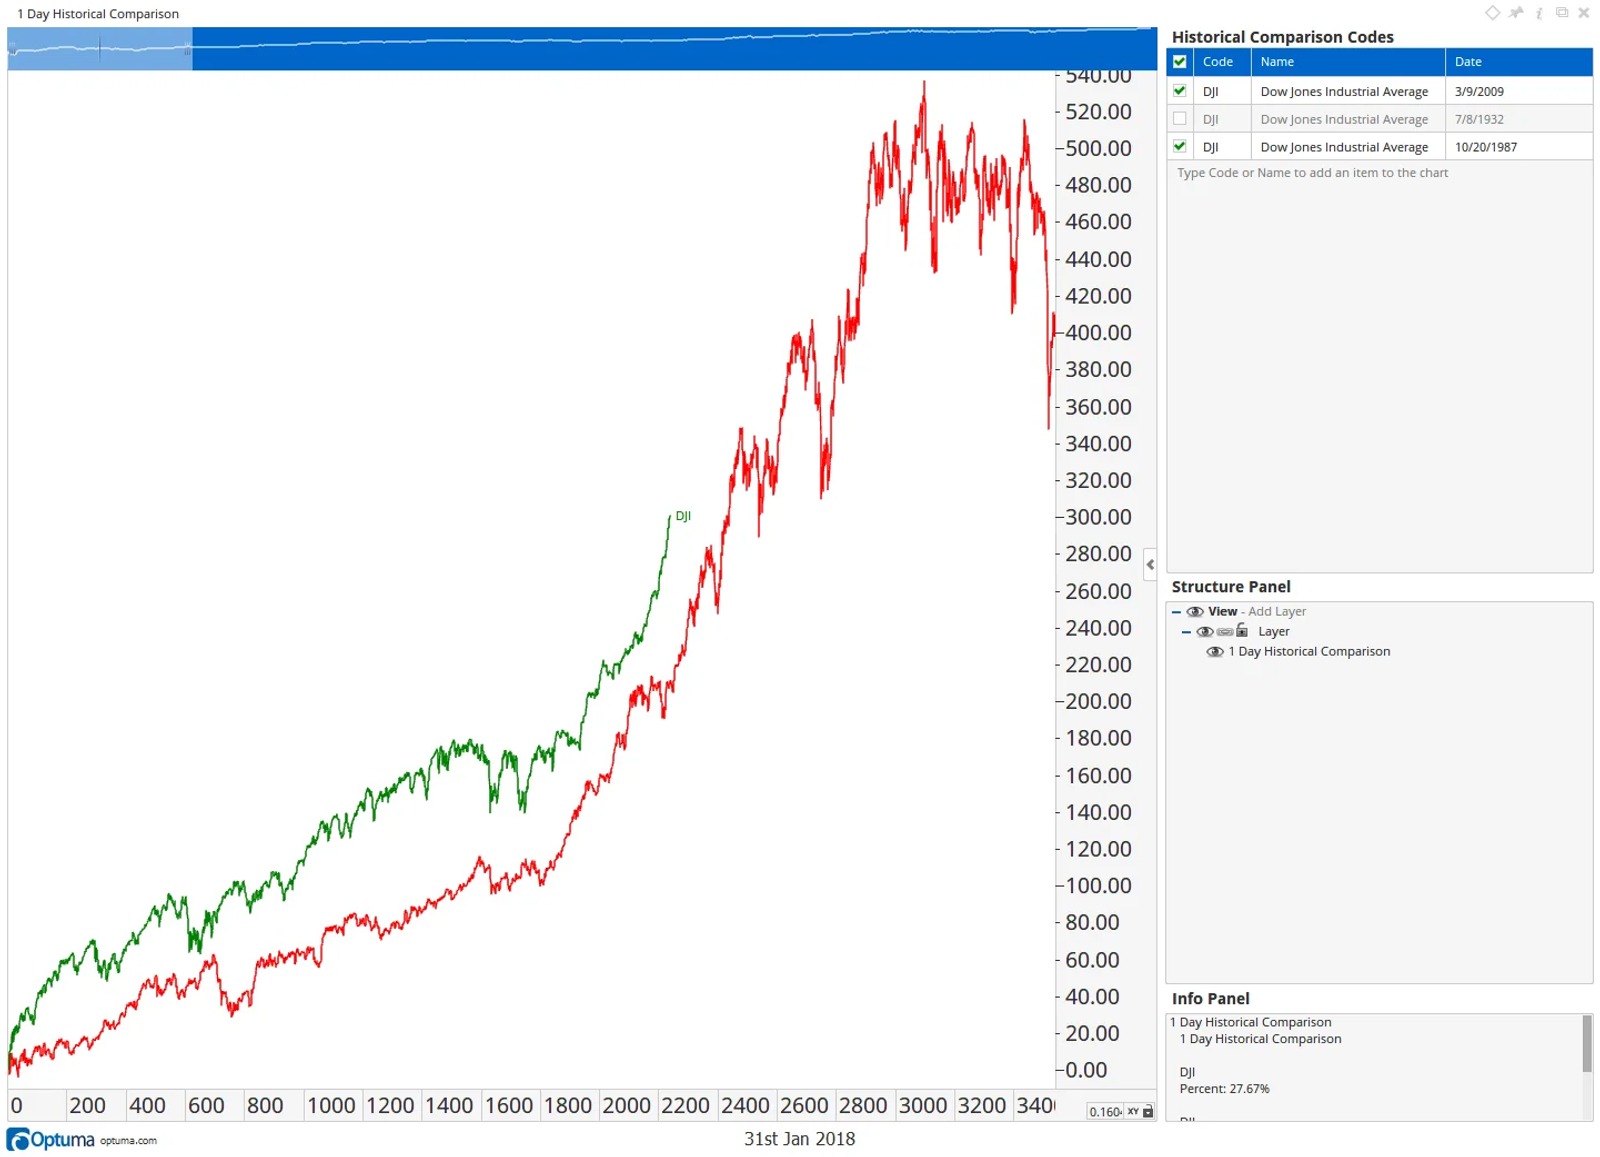
The equivalent period of time, to where we are now, in the 1987 line is 1996, that is, 2018 in green lines up with 1996 in the red line. So I went searching to see what the sentiment was back then. Here are some things I noticed:
- In 1996 the Internet was being increasingly used and companies were starting to talk about their web presence. Many people still did not have internet access (I remember mailing floppy disks to people who bought the software - and you think updates are a pain now!). Today we could be on the cusp of a similar revolution with Blockchain. Many companies are starting blockchain projects (including us - but more on that another time), a lot of people don't fully understand it, and many people are rushing in and investing in what ever they can find in the sector. While the technology is not as impressive as the Internet, the economic consequences are.
- 1996 was also a period of low volatility. In fact here is a headline from CNN Money in Aug 2017:
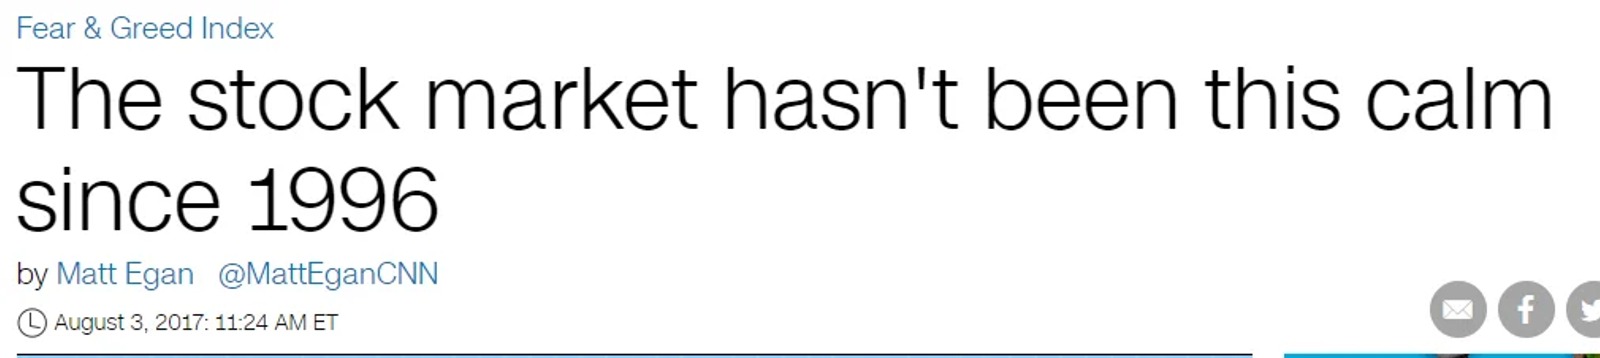
So both periods were a Low Vol rising market.
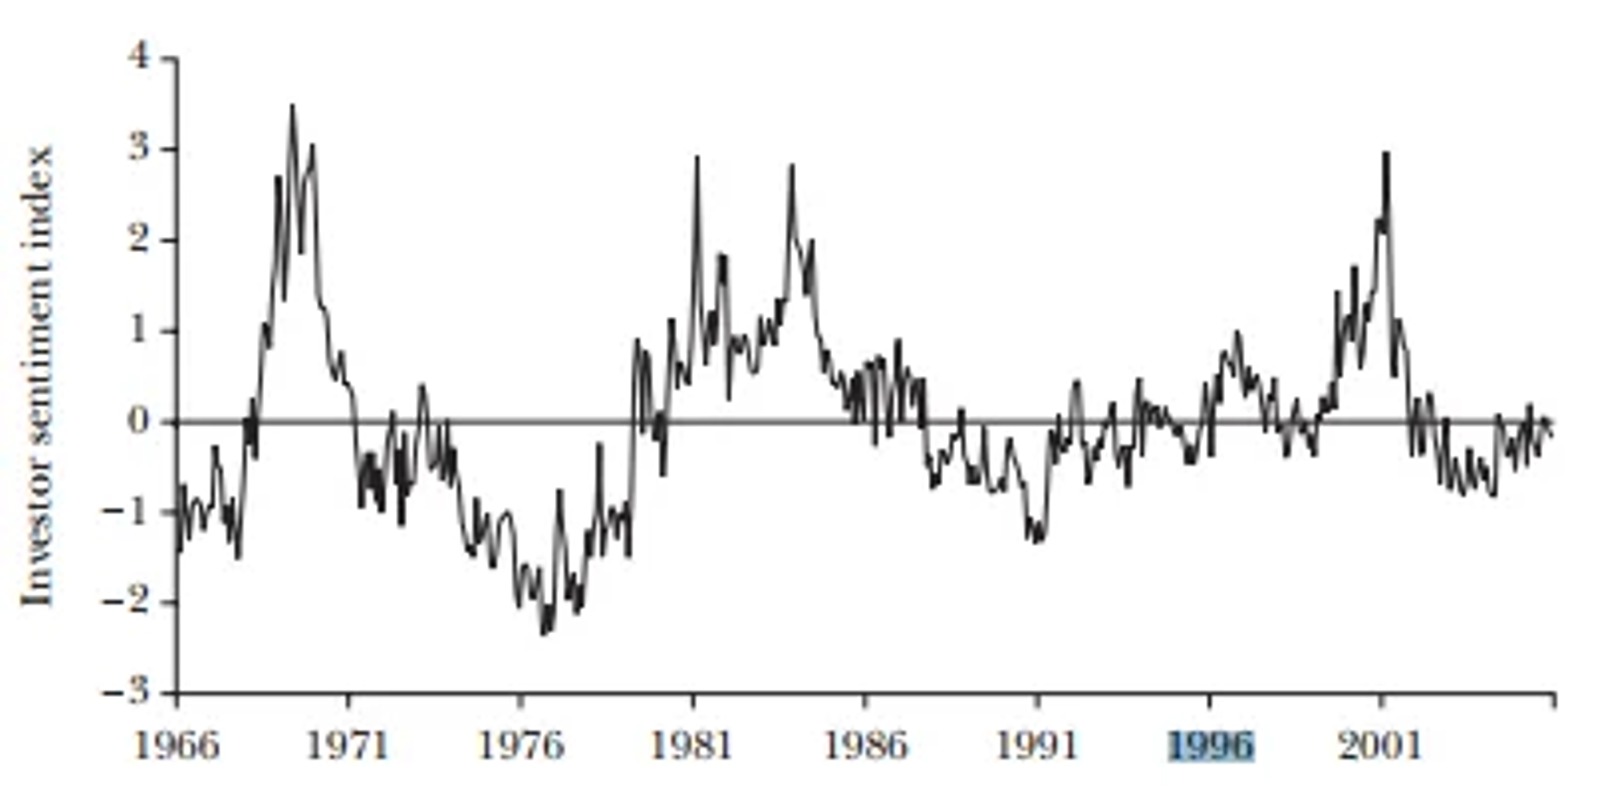
- In 2007, there was a paper released called Investor Sentiment in the Stock Market by Malcolm Baker and Jeffrey Wurgler. In it they had the following chart which measured investor sentiment from 1966 to 2002. What is astounding is that in the midst of a rampant bull market in 1996, so many investors were undecided with a slight bias to being negative. Sound familiar?
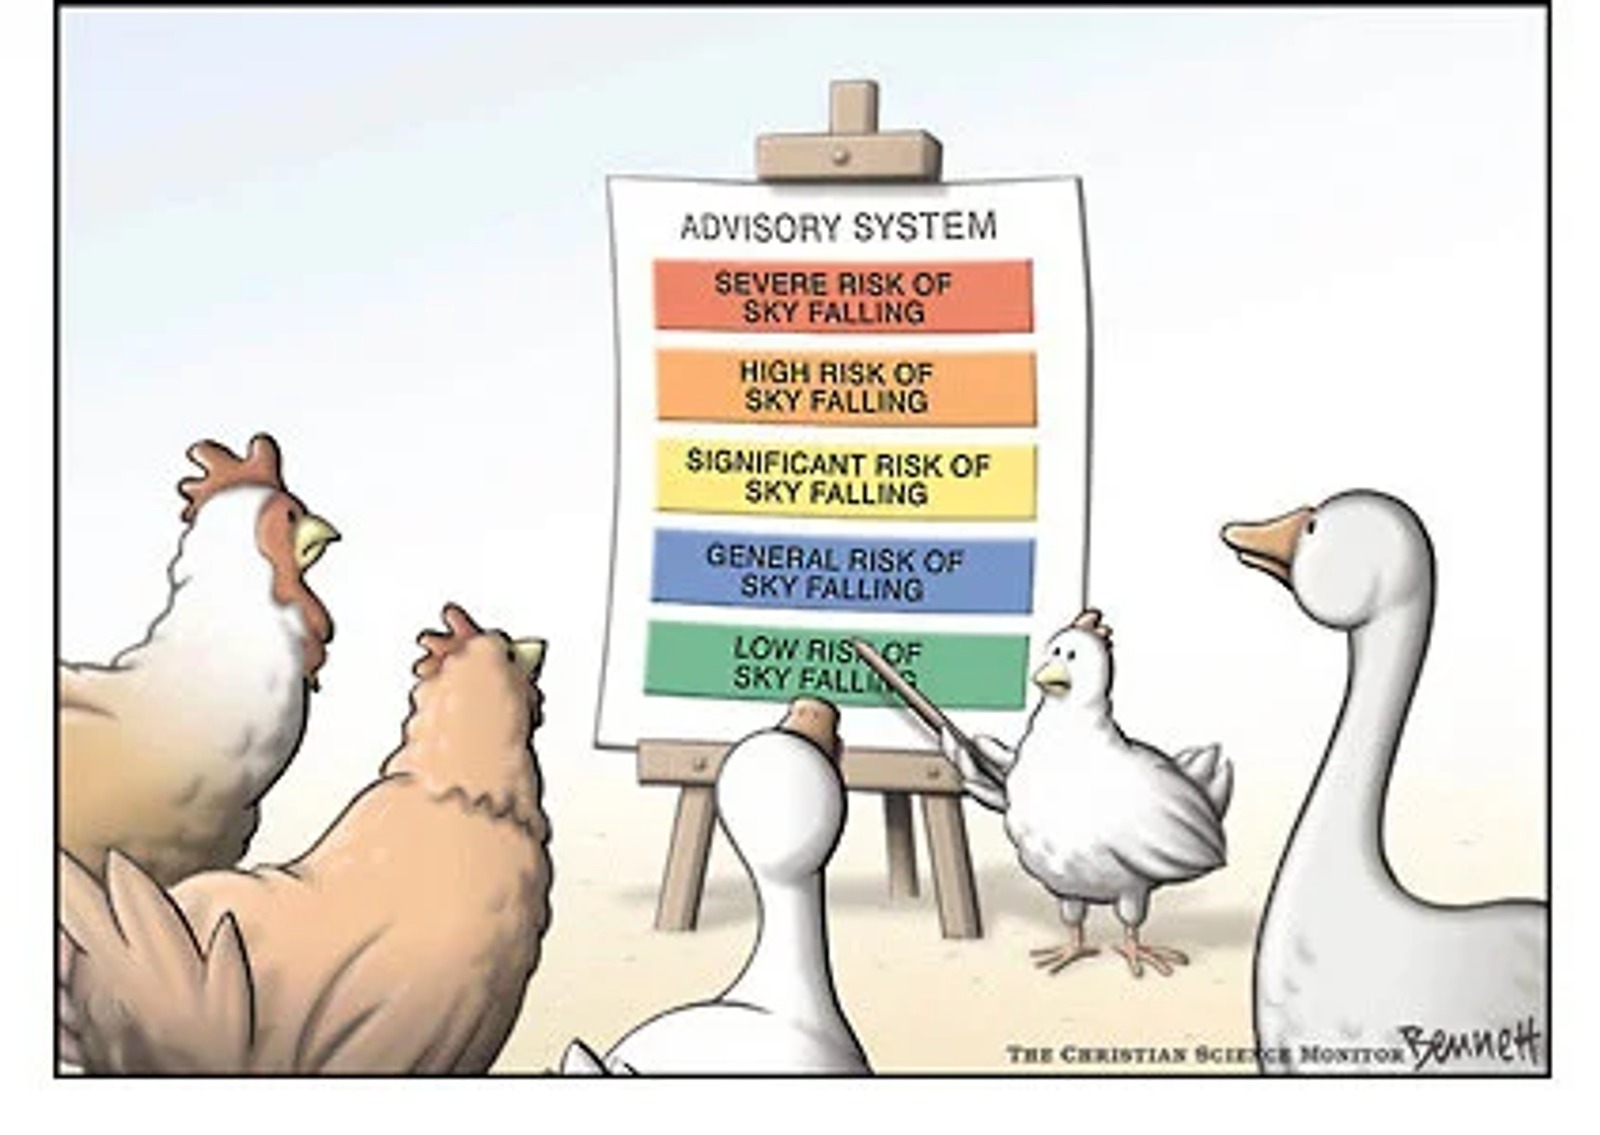
Of course a single case like this is not enough evidence to base investment decisions on in isolation, but since our markets are driven by the psychology of millions of individuals. We often see similar patterns happening as fear, greed, conservatism, regret, and all the other biases take hold. If 1987 truly is a good model to follow, then it looks like there is still a long way to go. This is also a good reminder to stick with the trend until we have a confirmation of a change. Sounds obvious but not easy to do when everyone is telling us that the sky is falling.

CEO / Founder Optuma
As a Computer Systems Engineer, Mathew started Market Analyst (now Optuma) within 18 months of completing his degree. From that point on, Mathew has made it his mission to build the very best software tools available.


