

VIX Remaining Low
Despite all that is going on in the world (wars, inflation, natural disasters, & Taylor Swift’s latest album), Stock Markets around the world have just continued on their merry way seemingly oblivious to everything. Confidence is so high in the stability of the market that the VIX is continuing its general downtrend and is now approaching all time low levels.
Remember that the VIX is a measure volatility based on 30-day Options. When “old” funds cannot sell because of the tax that sale would attract, they add Put Options to their portfolio to hedge against the risk that the market will fall. It is the increased buying of Options that causes the VIX to rise.
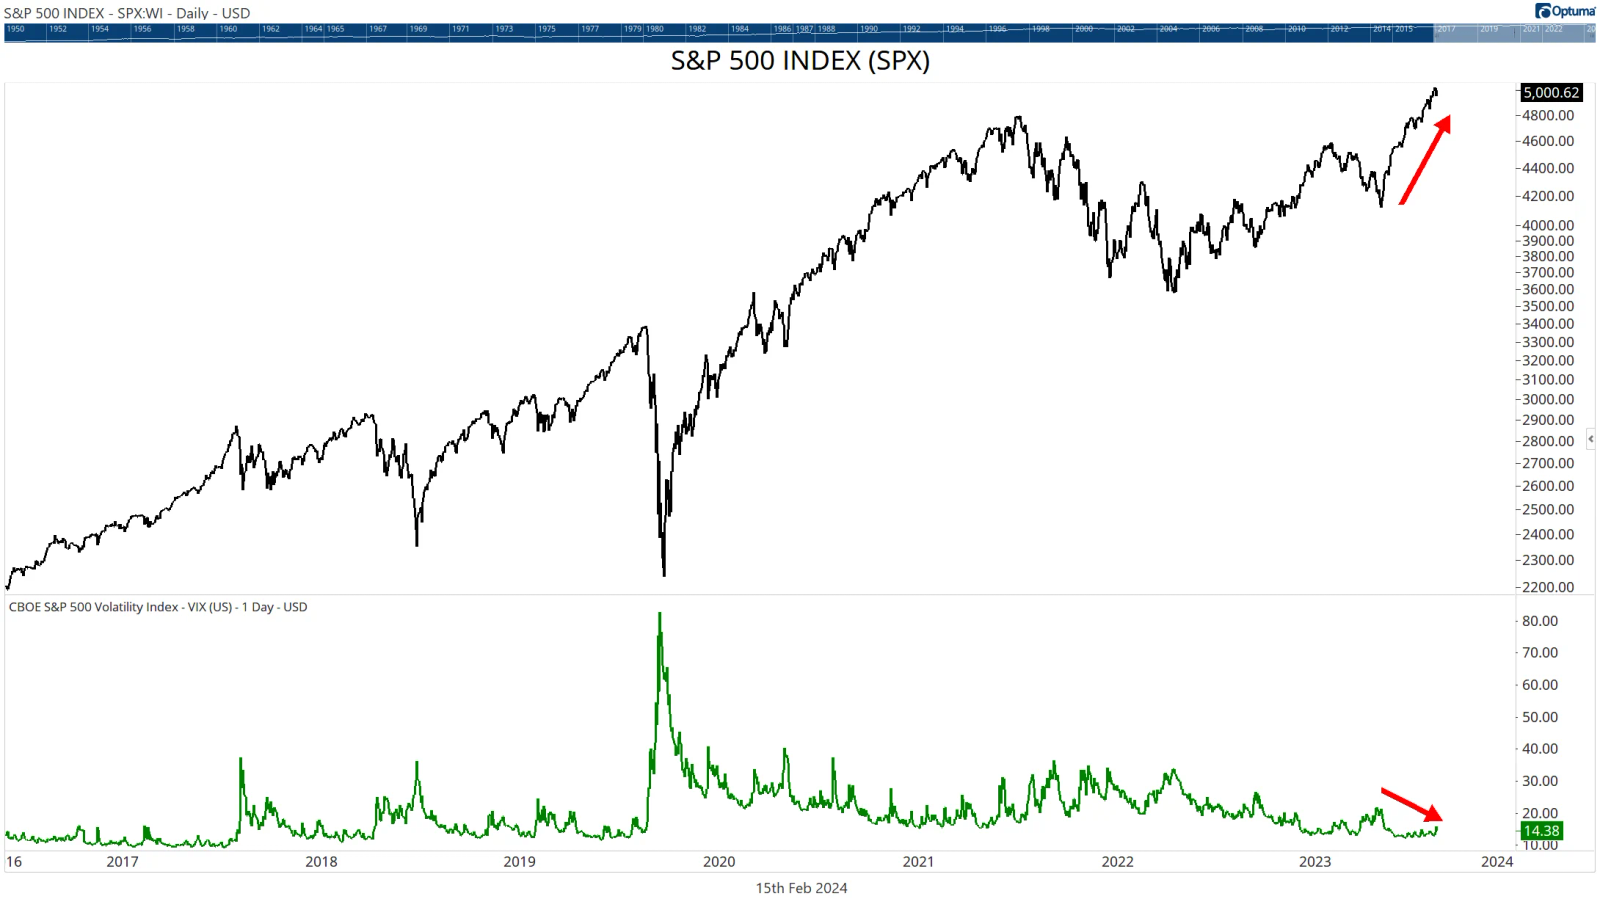
The low VIX values tell us that there are not a lot of options being added to Portfolios right now (it’s a little more complicated than that, but the general principle holds). You can see quite clearly in Chart 1 that the trend of the S&P500 is up while the trend in the VIX is down.
Low VIX Expectations
What can we expect from this environment of low VIX? Well, one thing is for sure, at some point in the future we’re going to have a spike in VIX as the market falls again—that’s inevitable. But we have no idea how long that will be away. This is when we look to history to give us a guide (not a prediction).
It is always interesting to look at the past to glean some idea of what we can expect in the future. When VIX falls to low levels, what can we expect?
In the short term, the signs are looking good for Stock Markets, values are increasing, volatility is falling, interest rates are also falling (or at least holding steady).
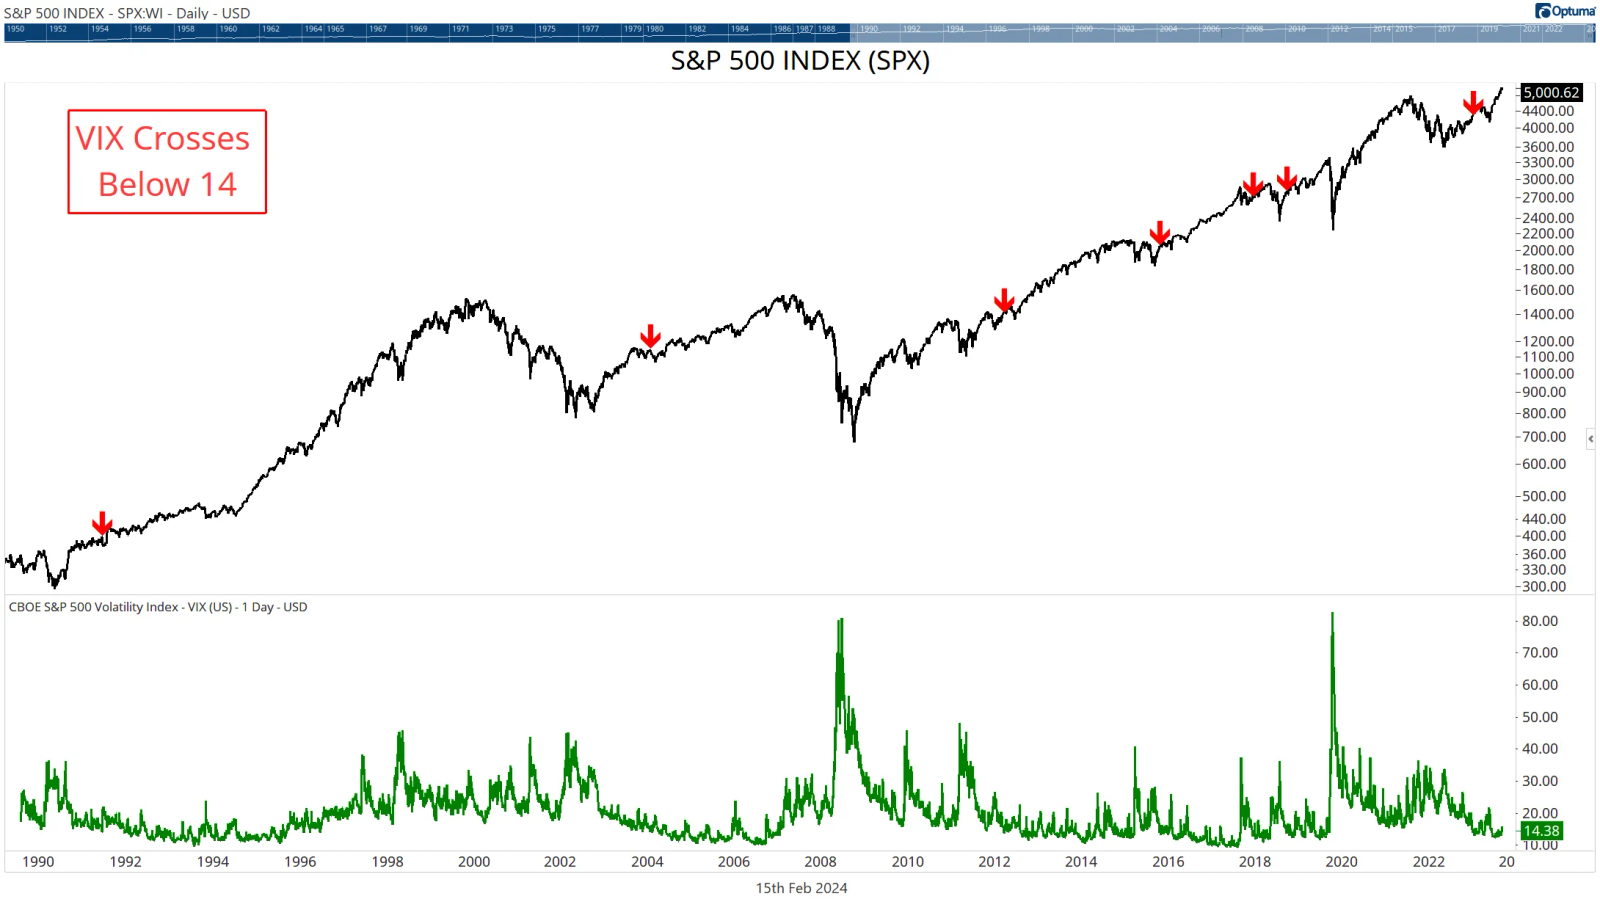
In Chart 2, I’ve added arrows to all the times that the VIX had been above 30 and then crossed below 14 for the first time. Just by looking at the chart you can see that it’s a nice signal that gives us confidence in the short-term outlook.
VIX Is not a Sell Signal
You may, like most people, be tempted to think about the VIX in terms of a sell signal. Eg, when VIX spikes, SELL! Yet I’m presenting it as a Buy (or at least Hold) signal.
We’ve done a lot of quantitative testing on this, and we cannot find a single scenario where selling on rising VIX works.
The problem is that the Option buying is a reaction to a fall in price. So the spike in the VIX happens after the fall in the S&P500 and by then, it’s too late to sell.
A Better VIX Signal
While we can find no suitable quantitative signal on rising VIX, there are some interesting Signals on falling VIX that you should lock away. It may be a few years before you can use these ones. Firstly, we can use the VIX above 25 as a filter. When it’s above, we turn off any long equity strategies and look for Shorts. When it’s below, we turn back on our long equity strategy. So rather than being a “Sell” signal, it becomes a “Don’t Buy” signal.
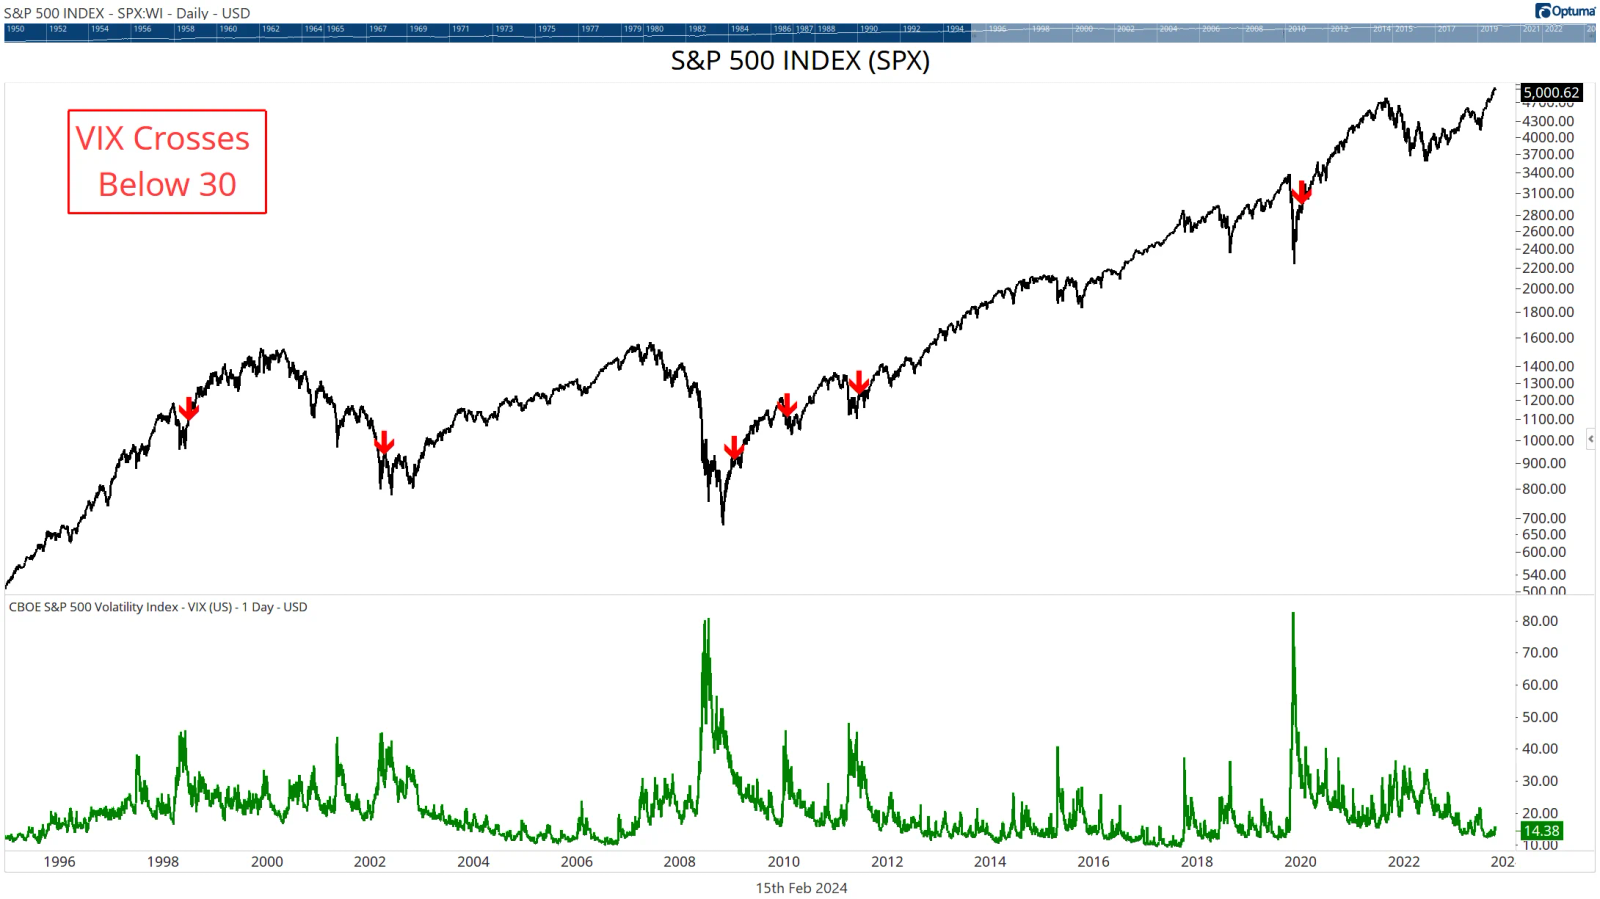
Secondly, When VIX rises above 45 (major panic) and then Crosses Below 30 as things settle down again, we get the signals you can see in Chart 3. They don’t happen often, and we can see in 1990 and 2000 there was still some downward movement after the signal, but how many times have you wondered when is the right time to get back into Stocks after a major crash? This VIX signal is something you should pay attention to.
Resource links
All full size charts can be viewed online at VIX Analysis Charts - Investopedia Chart Advisor - Feb 7 | Optuma Publishing

CEO / Founder Optuma
As a Computer Systems Engineer, Mathew started Market Analyst (now Optuma) within 18 months of completing his degree. From that point on, Mathew has made it his mission to build the very best software tools available.


