

This is the second in a series of articles on using Optuma's swing charts and overlays - particularly when it comes to creating scripts for scans or testing.
In the first article we looked at an easy way to identify swing trends using overlay colours and a simple scan formula. In this article we can take it a step further by looking at the swing direction within the current trend, i.e. to see whether the current swing is a dip down in an upward trend, or a bounce in a downward trend.
To scan for when the current swing is down but the overall trend is up we can combine the SWINGDOWN() function for direction, with the SWINGTRENDUP() function (or SWINGUP() and SWINGTRENDDOWN() for the opposite).
Here’s the formula for swings based on 10% price moves:
//Set Swing Criteria;
S1 = PERCENTSWING(PERCENT=10.0);
//Determine Trend and Direction;
SWINGTRENDUP(S1) and SWINGDOWN(S1) and CLOSE()>0
Now you might be wondering why the CLOSE()>0 condition is required to produce the desired results. This is one of the difficult issues regarding swing charts, in that there is not a swing value for every date, only when the swings occur (this is what we call a swing list). By adding CLOSE()>0 - which will always be true - this converts the swing list into a bar-by-bar list, therefore giving a swing value for every day, allowing the scan to work as expected.
SwingList vs BarList
If I’ve just confused you, click here for Mathew Verdouw’s detailed explanation on swing lists versus bar-by-bar lists
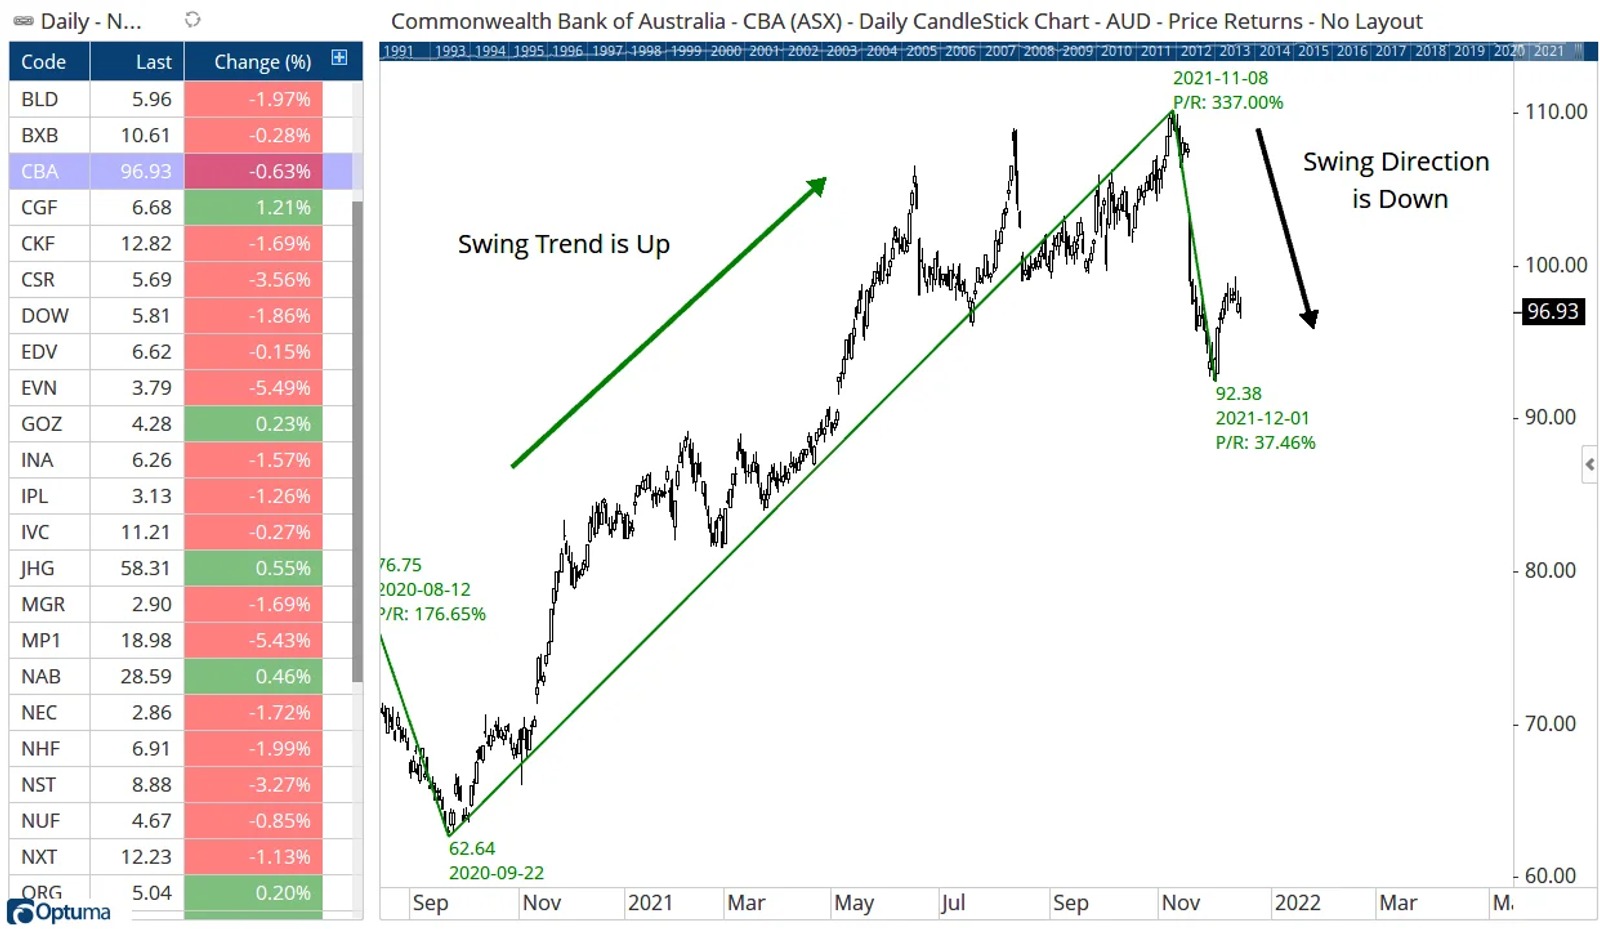
Using the above formula in a scan will return stocks that are currently in an uptrend but the latest direction is down, as per this example of CBA:
Linking scans to watchlists
See this video to link the scan results to a watchlist in a workbook. Whenever the workbook is opened the list will update with the latest scan results.
Creating a SwingRank value
Using these functions it is possible to create a ranking value depending on the current swing trend and direction. These are the four scenarios, along with their SwingRank value:
Swing Trend negative and Direction negative: SwingRank = 0 Swing Trend negative and Direction positive = 1 Swing Trend positive and Direction negative = 2 Swing Trend positive and Direction positive = 3
Here’s an example of the Dow 30 stocks in a watchlist, based on a 3 bar Gann swing:
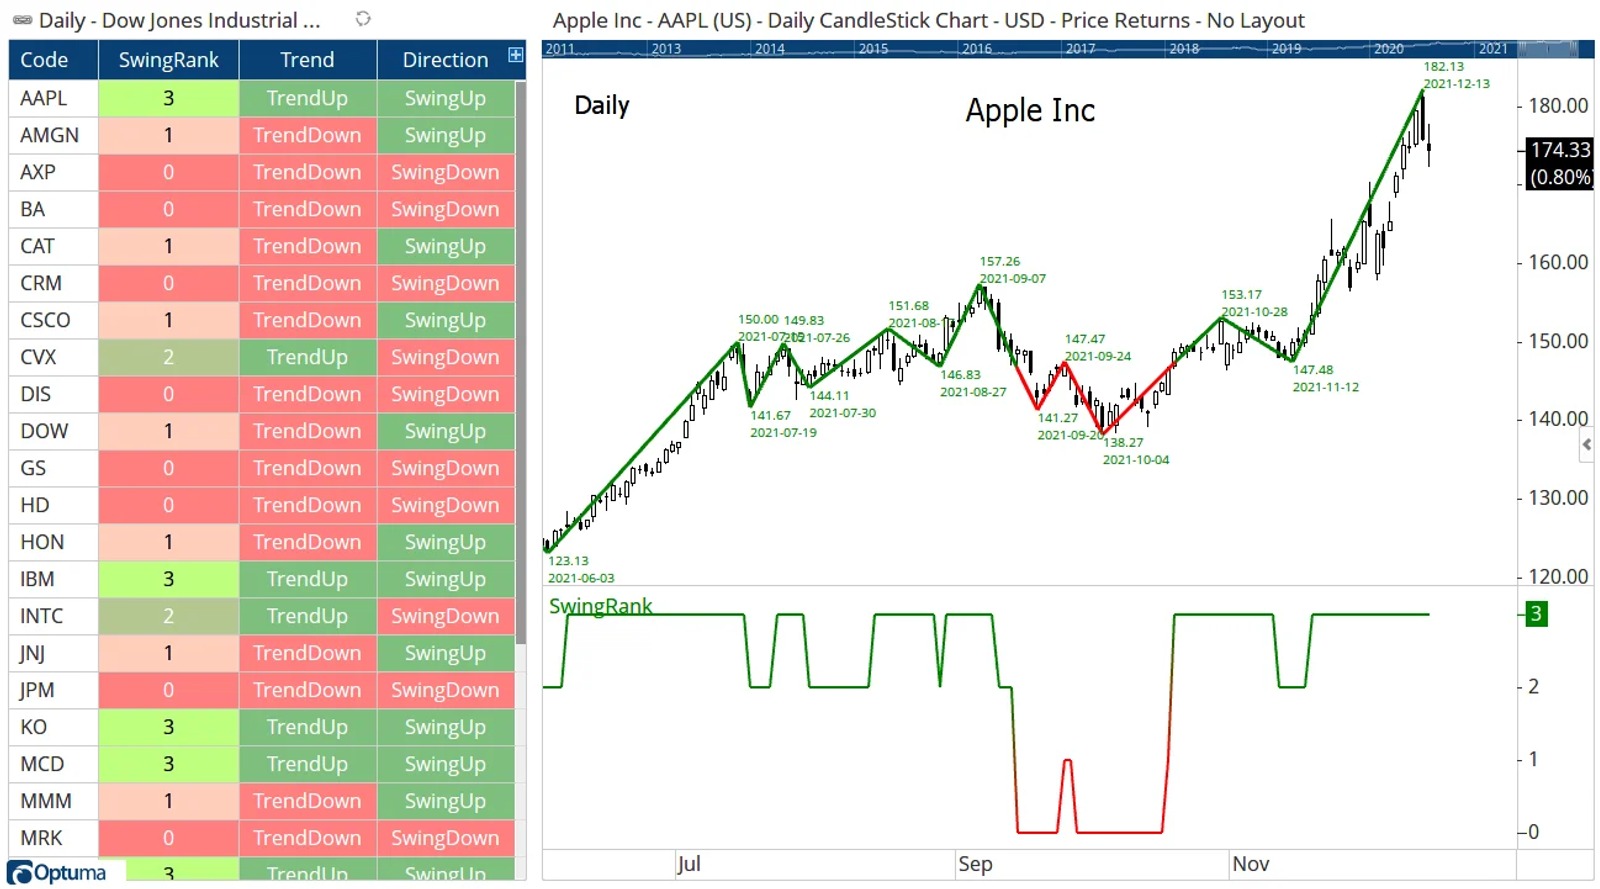
Apple is showing a current value of 3 as both the trend and direction are up, whereas CVX is a 2 and in a possible ‘buy the dip’ situation, with plenty showing 0s or 1s.
Here’s the formula to calculate the SwingRank (remember to change S1 variable to use a different swing type):
//Set Swing Criteria;
S1 = GANNSWING(SWINGCOUNT=3, METHOD=Use Next Bar);
//Determine Trend and Direction;
T1 = SWINGTRENDUP(S1) and CLOSE()>0;
D1 = SWINGUP(S1) and CLOSE()>0;
//Calculate rank values;
IF(T1 == 1 and D1 == 1, 3, IF(T1 == 0 and D1 == 0,0, IF(T1 == 1 and D1 == 0,2,1)))
Clients can click the button on the right to save and open a sample workbook with separate tabs for Australian and US markets with the SwingRank watchlist column (based on daily 3 bar Gann Swings). For other regions or lists clients can click the Linked to List watchlist property and select an alternative Symbol List to use.
Next time we’ll look at comparing previous swing values which can be used to identify consecutive higher highs or lows, or to calculate retracement levels.
Apple is showing a current value of 3 as both the trend and direction are up, whereas CVX is a 2 and in a possible ‘buy the dip’ situation, with plenty showing 0s or 1s.
Here’s the formula to calculate the SwingRank (remember to change S1 variable to use a different swing type):
//Set Swing Criteria;
S1 = GANNSWING(SWINGCOUNT=3, METHOD=Use Next Bar);
//Determine Trend and Direction;
T1 = SWINGTRENDUP(S1) and CLOSE()>0;
D1 = SWINGUP(S1) and CLOSE()>0;
//Calculate rank values;
IF(T1 == 1 and D1 == 1, 3, IF(T1 == 0 and D1 == 0,0, IF(T1 == 1 and D1 == 0,2,1)))
Senior Software Specialist at Optuma
Darren is the senior Software Specialist at Optuma based in Brisbane, Australia. Darren grew up in the UK and attended college in the USA where he earned a BA in Economics from St Mary's College of Maryland. He went on to spend a few years working at the Nasdaq Stock Market in Washington DC. Darren joined Optuma in 2009 after attending an introductory technical analysis course that used the software.


