

A binary arbitrage strategy is one where you buy A when condition X is true, and then sell A and buy B when condition X is no longer true.
Let’s take stocks vs bonds, where you want to buy stocks when they are relatively stronger than bonds, and buy bonds when they are relatively stronger than stocks.
This is possible to test in the Optuma back tester, but first we need to determine when one asset is stronger than the other by creating a relative strength ratio chart by creating a Custom Code{:target="_blank"}. Here’s an example where we create a ratio chart of the S&P 500 Index ETF ($SPY) divided by the iShares 20+ Year Treasury Bond ETF ($TLT), and also its 50-period moving average (in blue):
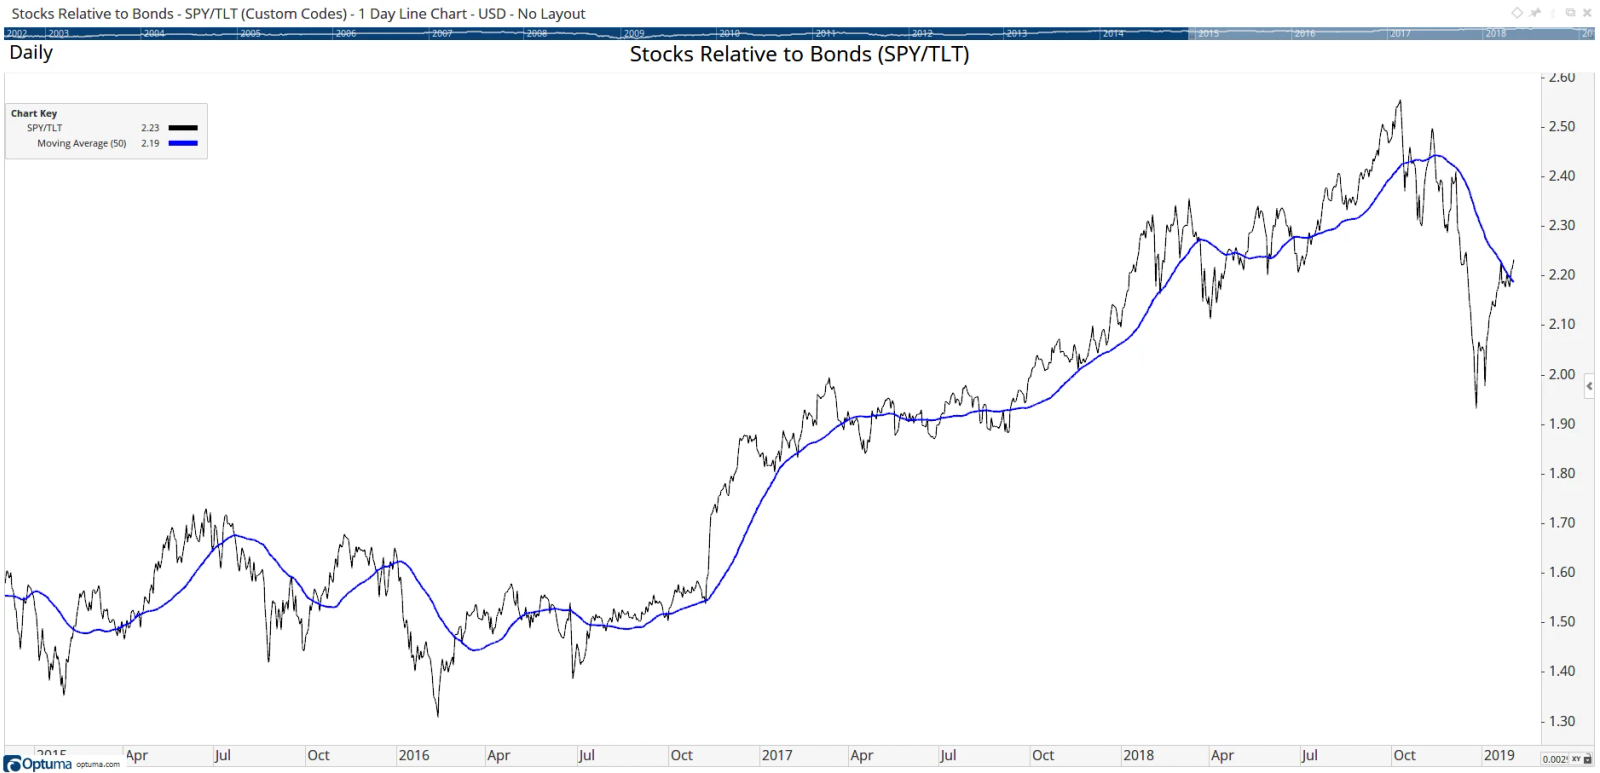
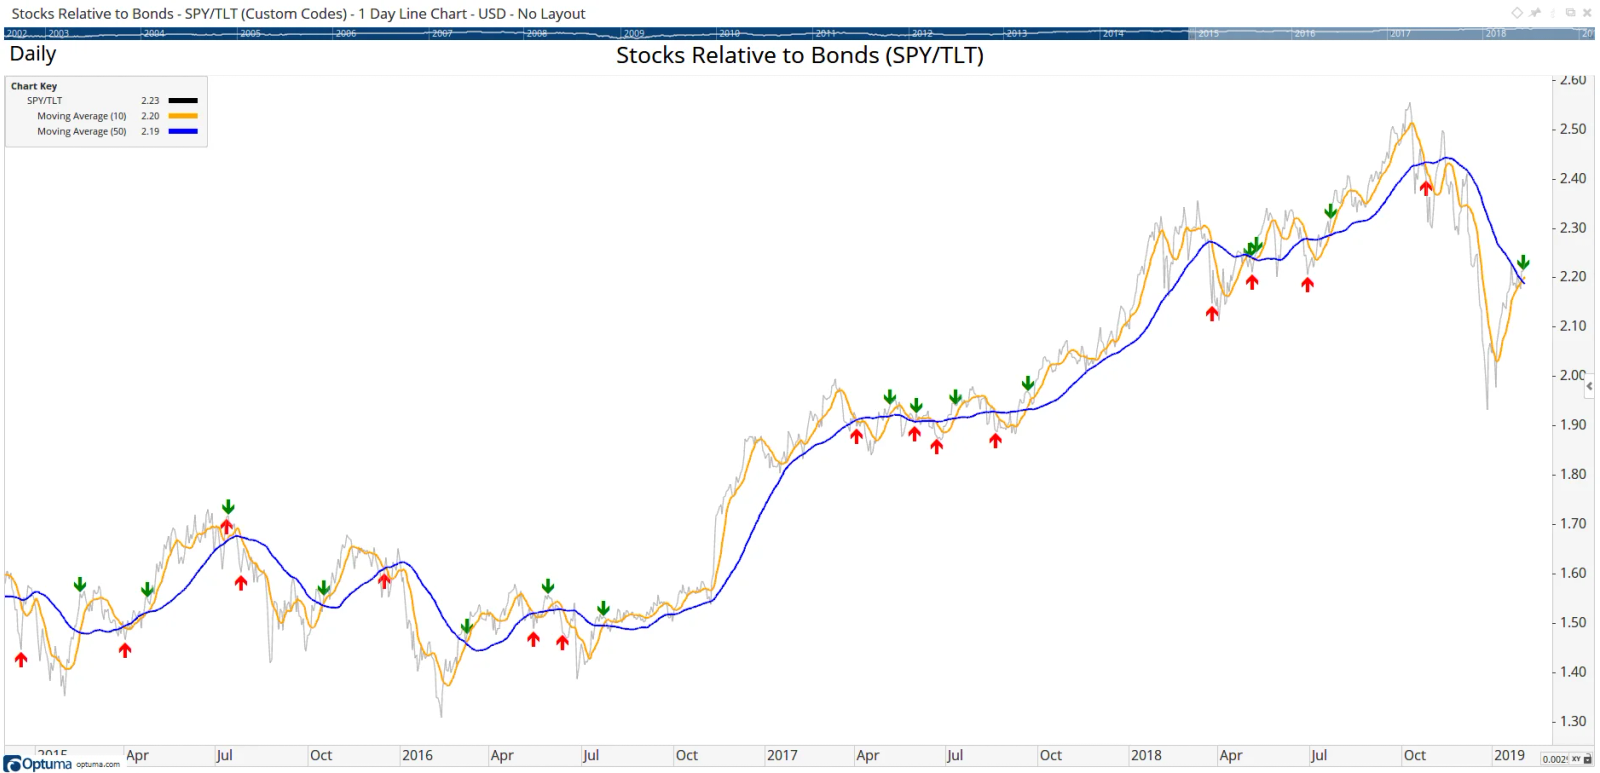
When the black line is above the moving average then stocks are stronger than bonds, and weaker when below the moving average, so in our backtest we would want to buy SPY when the ratio crosses above the moving average, and then sell SPY and buy TLT when the ratio crosses below, because bonds are now relatively stronger. This is getting there but there is still a bit of whipsaw going on. To smooth the ratio and to prevent choppiness we can use a shorter-term moving average crossover to generate the signal.
Below shows the entry and exit signals when a 10-period moving average in orange crosses the 50-period:
So how do we test this in the Backtester? The first thing we need to do is to create a manual Symbol List{:target="_blank"} containing the two ticker symbols used in the test – in this example SPY and TLT, in a list which I’ve called SPY/TLT:
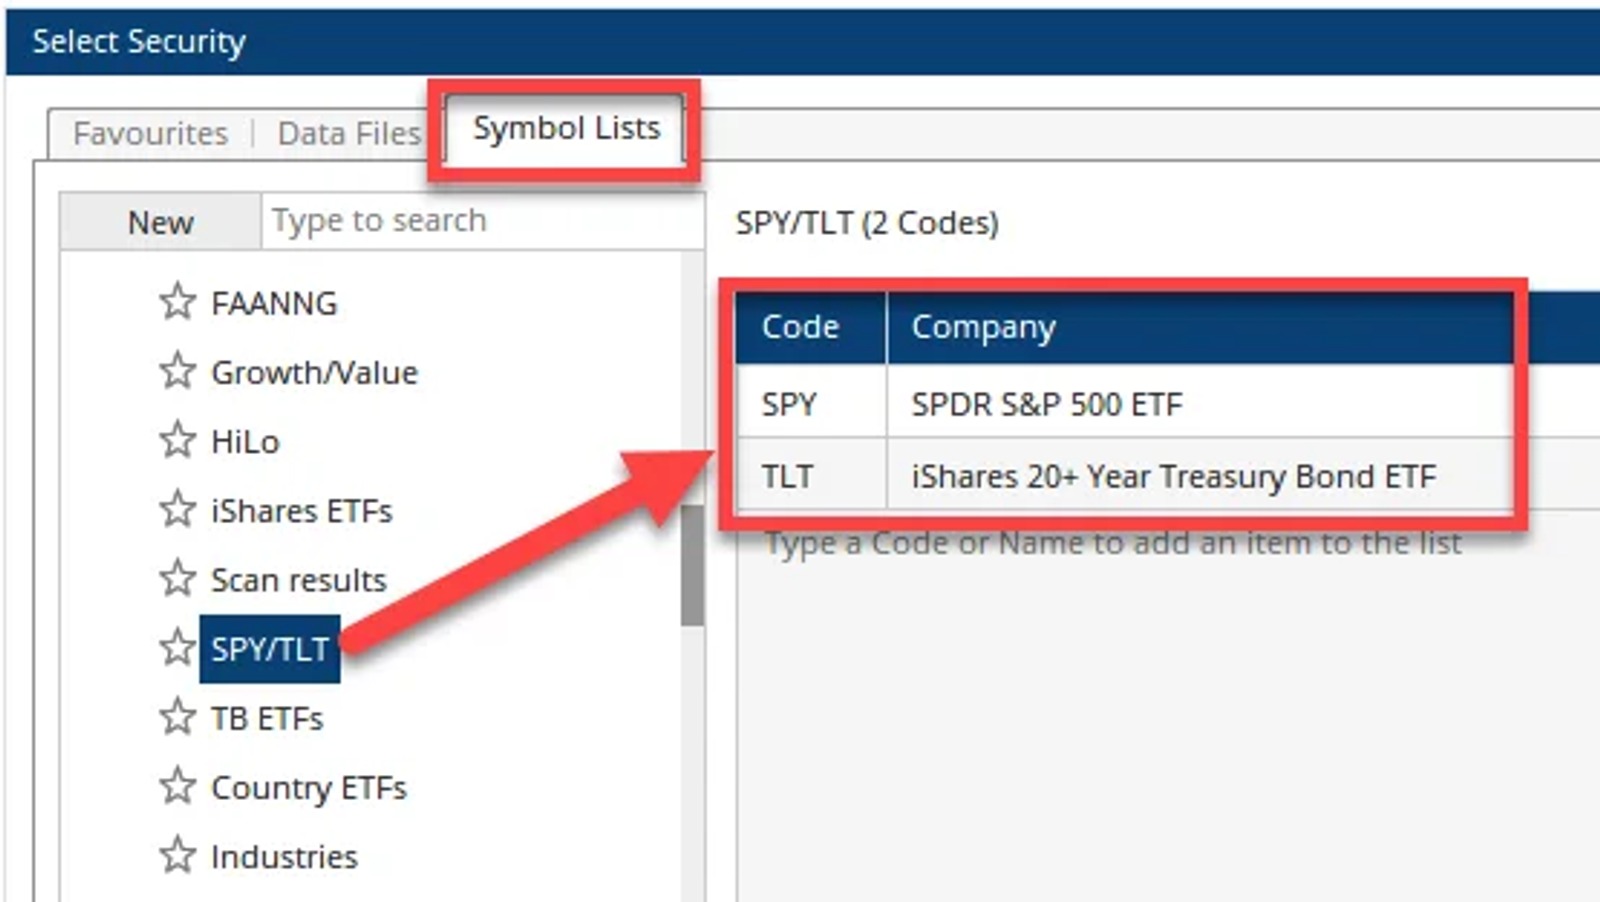
In the backtest setup we select the SPY/TLT symbol list under Back Test on Multiple Codes with the following entry formula. In this formula I am using the ISTICKER() function to select the appropriate symbol for the crossover.
Remember from a logic perspective that we want to buy SPY when the ratio crosses above the average. That condition will be true for both symbols, but the IsTicker() condition means that only the symbol which matches will be the one that is bought:
// Calculate the SPY/TLT ratio
S1 = GETDATA(CODE=SPY:US);
T1 = GETDATA(CODE=TLT:US);
Ratio = S1/T1;

//Calculate the moving averages of the ratio
MA10 = MA(Ratio, BARS=10, CALC=Close);
MA50 = MA(Ratio, BARS=50, CALC=Close);

//When 10MA crosses above 50MA buy SPY, or buy TLT if crosses below
MA10 CrossesAbove MA50 and ISTICKER(CODE=SPY:US) or
MA10 CrossesBelow MA50 and ISTICKER(CODE=TLT:US)
For the Exit criteria we use the opposite conditions, i.e. sell SPY when it crosses below the average, and sell TLT when it crosses above. Copy the entry script formula and then change the last lines:
//When 10MA crosses below 50MA sell SPY, or sell TLT if crosses above
MA10 CrossesBelow MA50 and ISTICKER(CODE=SPY:US) or
MA10 CrossesAbove MA50 and ISTICKER(CODE=TLT:US)
Because the strategy is binary (i.e. all your capital is either in stocks or bonds) the Equity Percentage should be set to 100%, before executing the test over the timeframe required.
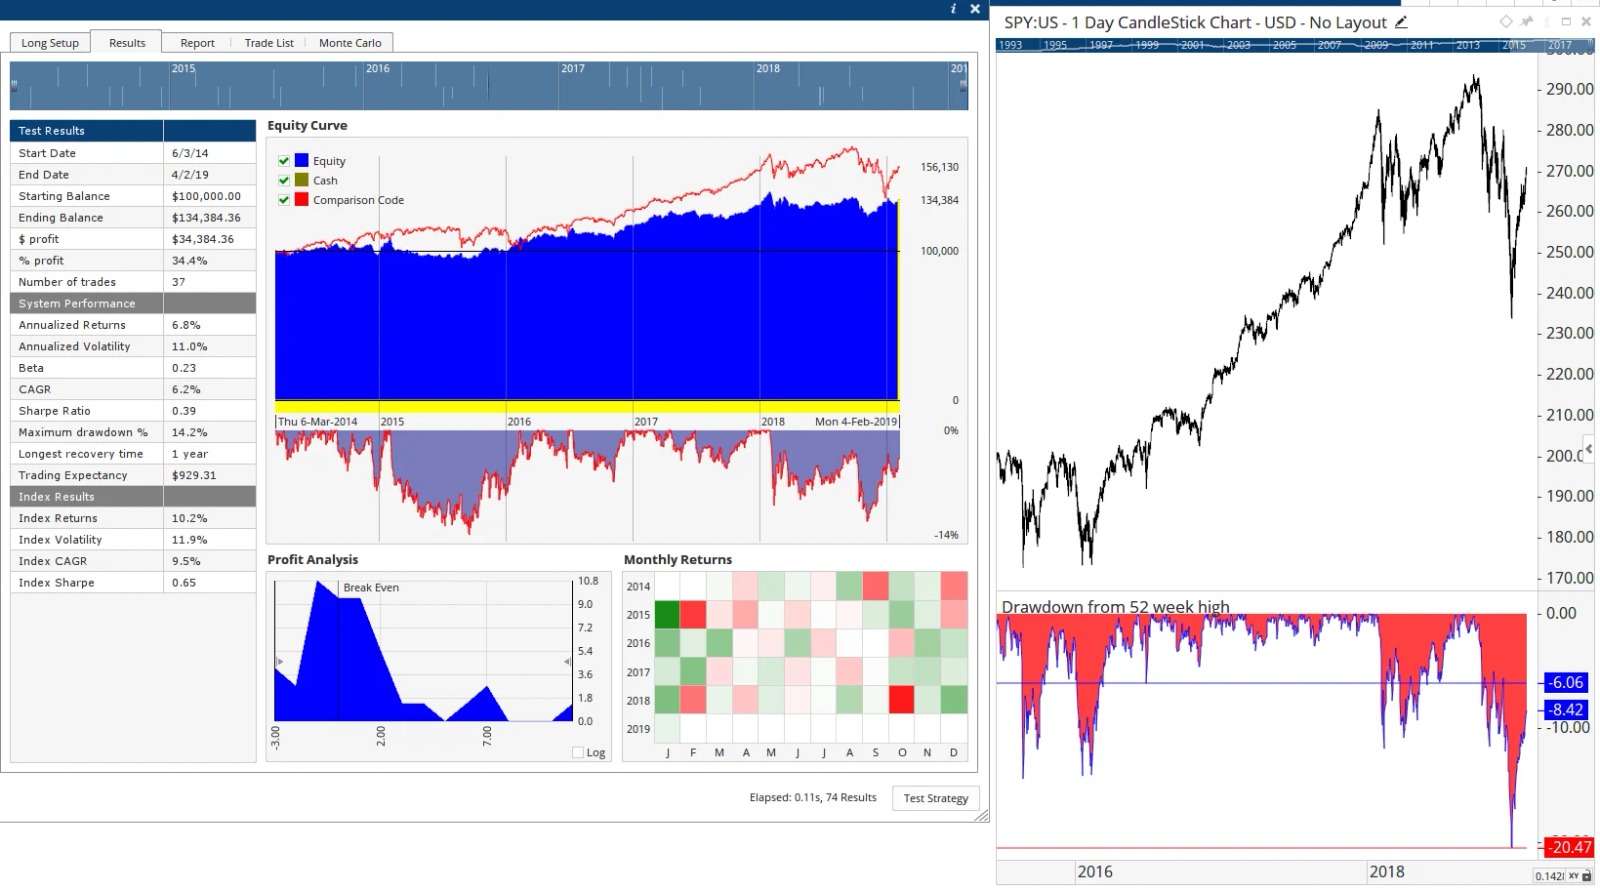
Here’s the results over the last 5 years, starting with the SPY entry on March 6th 2014, showing the 37 trades with annualised returns of 6.8%, and a maximum drawdown of 14%:
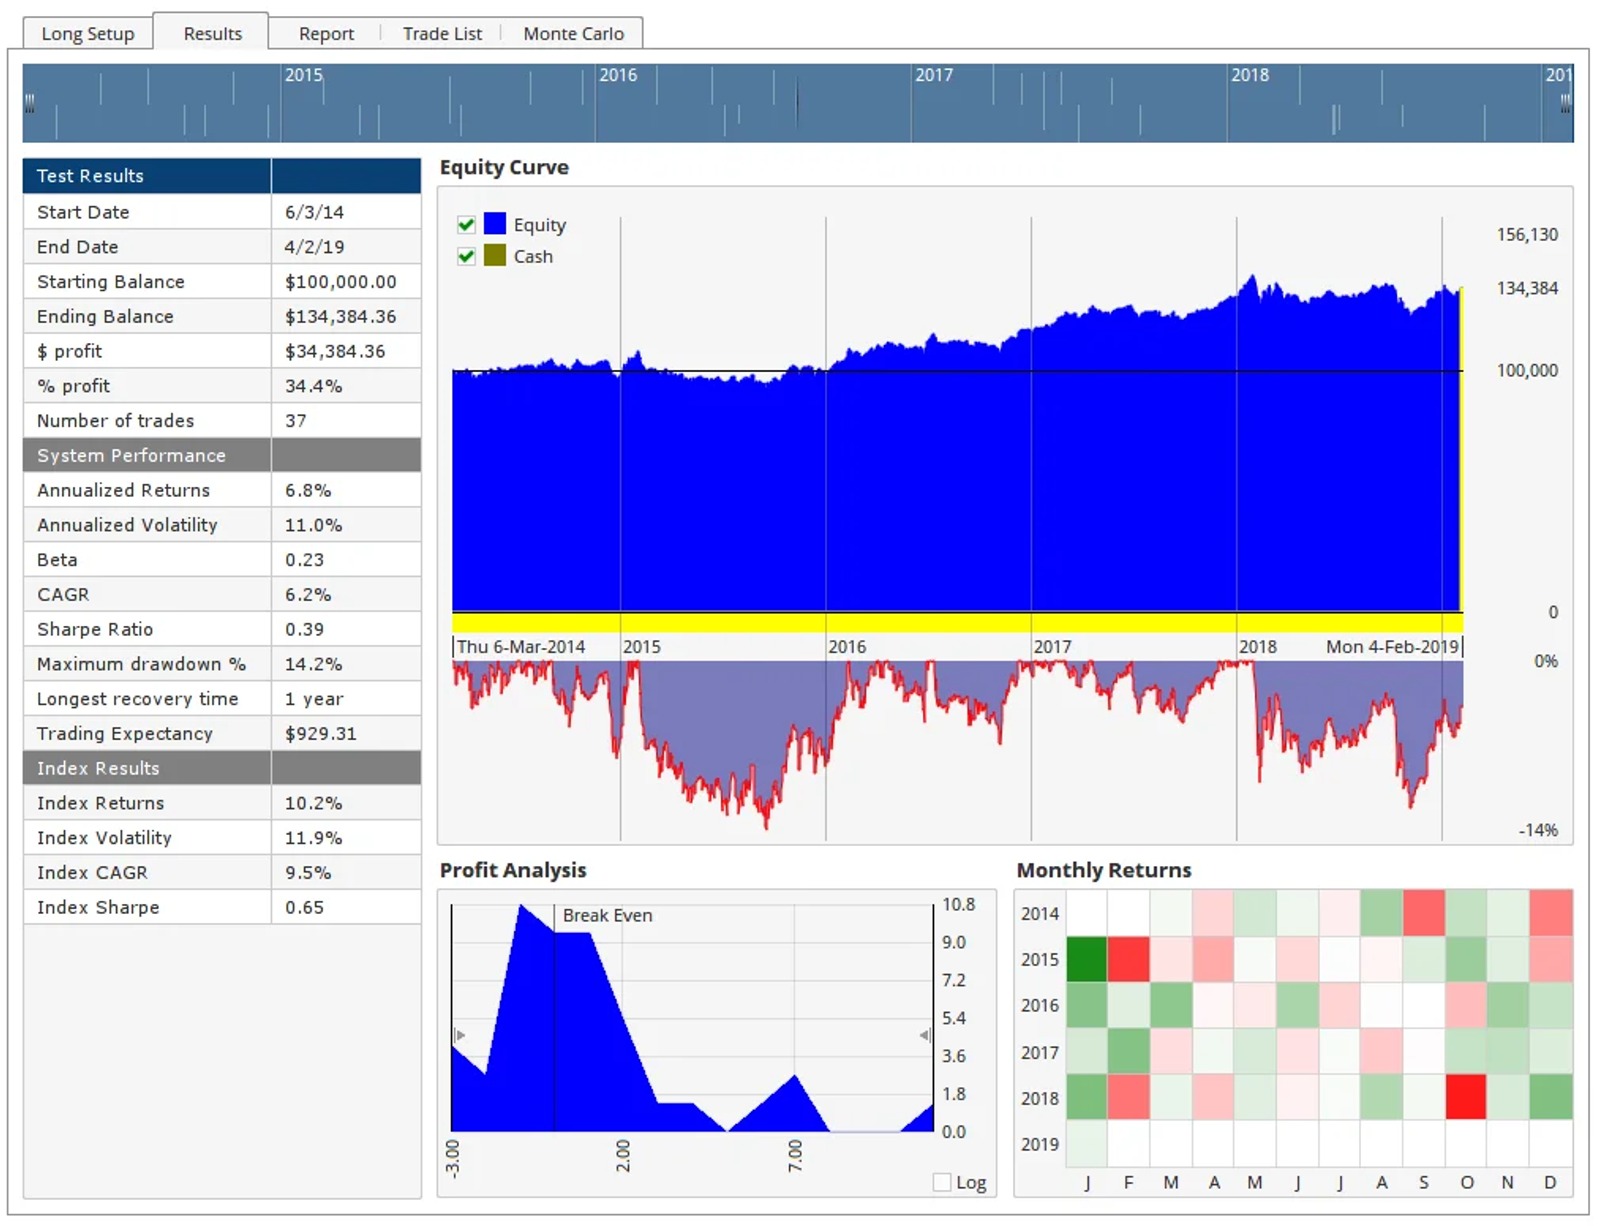
But how does that compare with buying and holding stocks over that time? We can add that as a comparison code, and you can see that SPY would have out-performed the strategy over that timeframe (the red line in the equity curve window), with annualised returns of 10.2%, but with increased volatility, and a higher drawdown of 20.5%:
So maybe the signals can be tweaked, eg when the moving averages of the ratio chart are sloping up for the SPY entries, or when SPY is trading below its 50-period MA for the SPY exits. The point of this post is not to give you a trading strategy but to show you how you can set up binary strategies like this for yourself.
Another example is to buy Growth stocks when relatively stronger than Value stocks, and sell Growth and buy Value when vice versa. Gold is strongly negatively correlated to the US Dollar Index (DXY) so that could be another example using the ratio chart set up.
Now we have the setup in the Back Tester it’s just a matter of creating the symbol list for the required symbols, and tweaking the entry and exit formulas.
As always, we love to hear feedback so if you have any questions please comment below or contact us via support, and for scripting formula queries don’t forget to search the **Scripting Forum**{:target="_blank"} if you get stuck, and post a query if you can’t find the answer.

Senior Software Specialist at Optuma
Darren is the senior Software Specialist at Optuma based in Brisbane, Australia. Darren grew up in the UK and attended college in the USA where he earned a BA in Economics from St Mary's College of Maryland. He went on to spend a few years working at the Nasdaq Stock Market in Washington DC. Darren joined Optuma in 2009 after attending an introductory technical analysis course that used the software.


